
TFlow On Balance Volume is the running sum of the differences between bid and ask volume for each TFlow bar. The starting point of this sum is set via the study parameters. This study only works when applied to TFlow bars. It works with aggregated TFlow bars as well. The image below shows the study plotted on a 5-bar aggregated TFlow chart.
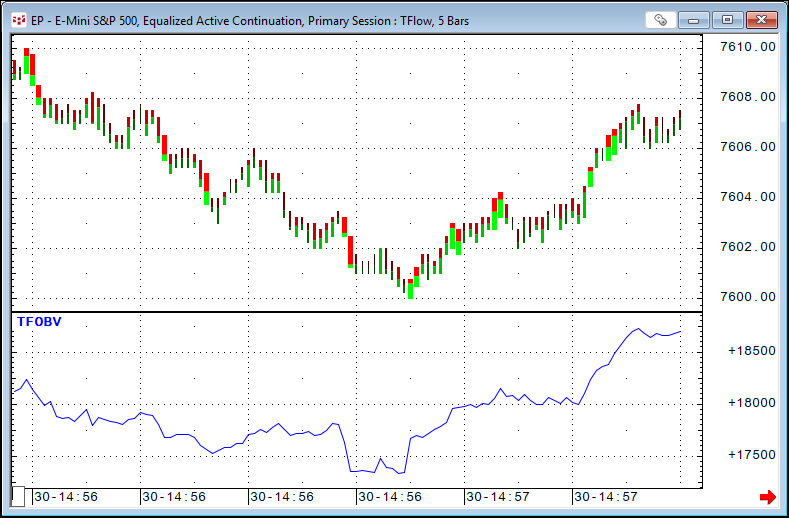
TFlow OBV provides the measure of difference between buying and selling volume compared to the classic on balance volume (OBV). The OBV study is the running sum of total volume traded for the price bar. The current bar's volume is added to the previous value if the bar closes higher than the previous bar and the total traded volume is subtracted if the bar closes lower than the previous bar. You don't know how much of the traded volume was actually buying or selling volume. TFlow OBV provides that information.
The parameters for the Start Time:
- Number of bars back from current bar
- Date and time
- Number of days back from current bar
The study is used to confirm the direction of the trend and divergence between the study and the market may indicate a change in the direction of the market trend.
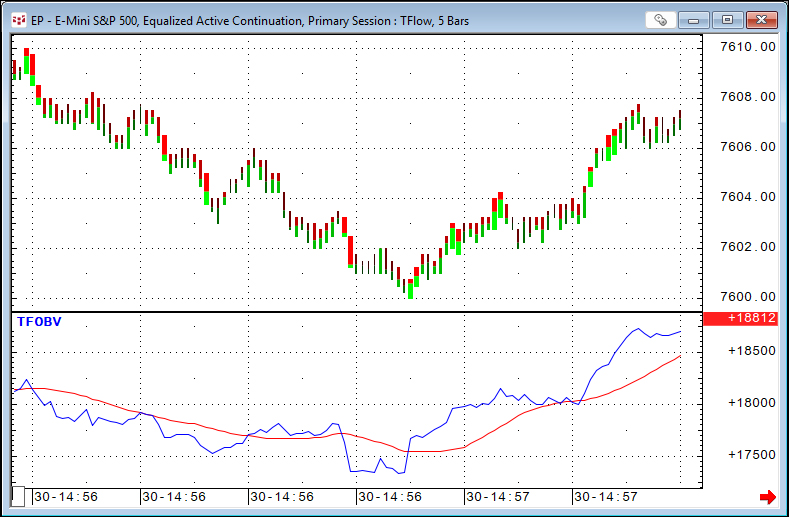
A typical modification to a study such as the TFlow OBV study would be to apply a moving average to the study. Below the TFlow OBV has a 20-bar moving average applied to it. The moving average smooths the fluctuations of the TFlow OBV study. However, there is the typical lag inherent to applying a moving average.
Another modification to smoothing the TFlow OBV study would be applying the Moving Linear Regression study also known as the End Point Moving Average. The study fits an unseen line to the set of data points. The process of fitting the line to the data points uses the least squares technique. This technique finds the line that minimizes the sum of the squares of the distances between each point and the line. The study is the last point of the best fit line.
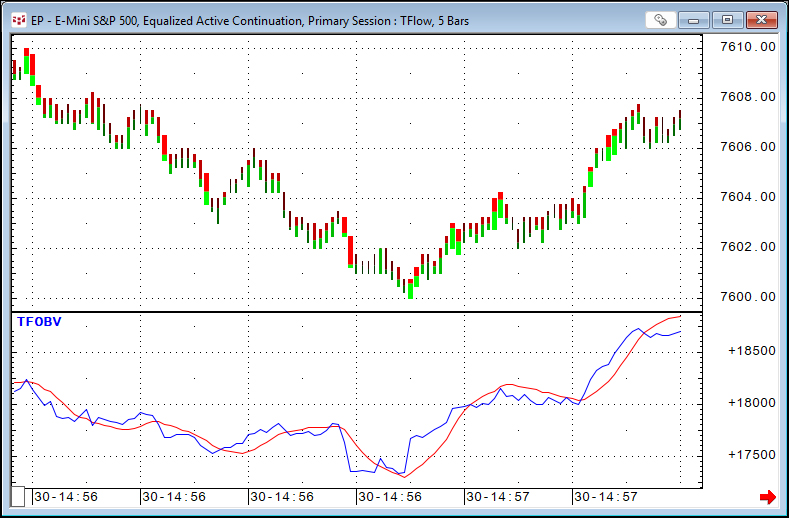
The image above shows how the MLR study applied to the TFlow OBV study smooths the study and responds faster to the changes in the direction of the TFlow OBV study compared to the moving average. The downloadable PAC is set to a start time of 500 bars.
Requires CQG Integrated Client or CQG QTrader.