
Customers using our flagship product, CQG Integrated Client (CQG IC), have access to a new study called Algo Orders. Using a proprietary algorithm, this trading activity indicator detects and… more
Workspaces
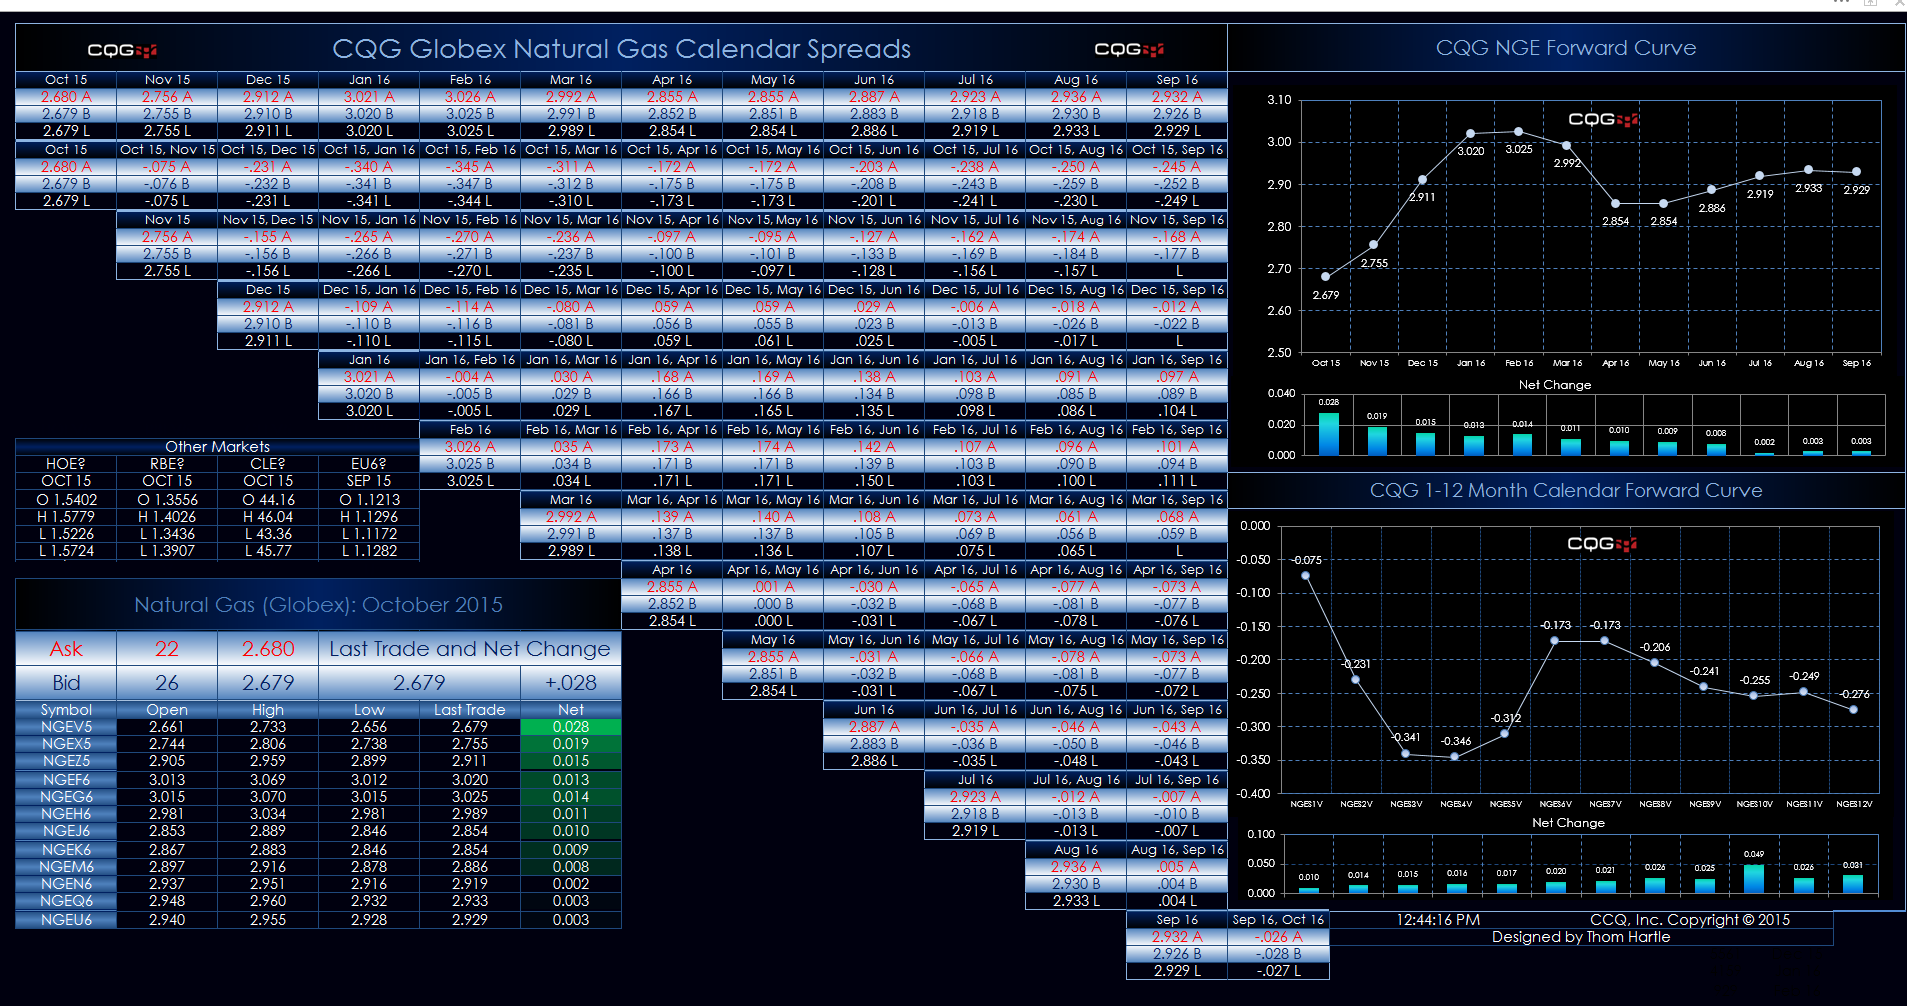
This Microsoft Excel® spreadsheet uses the CQG Toolkit to pull in natural gas market data traded on the CME Globex exchange. It uses a matrix style presentation with the outrights displayed along… more
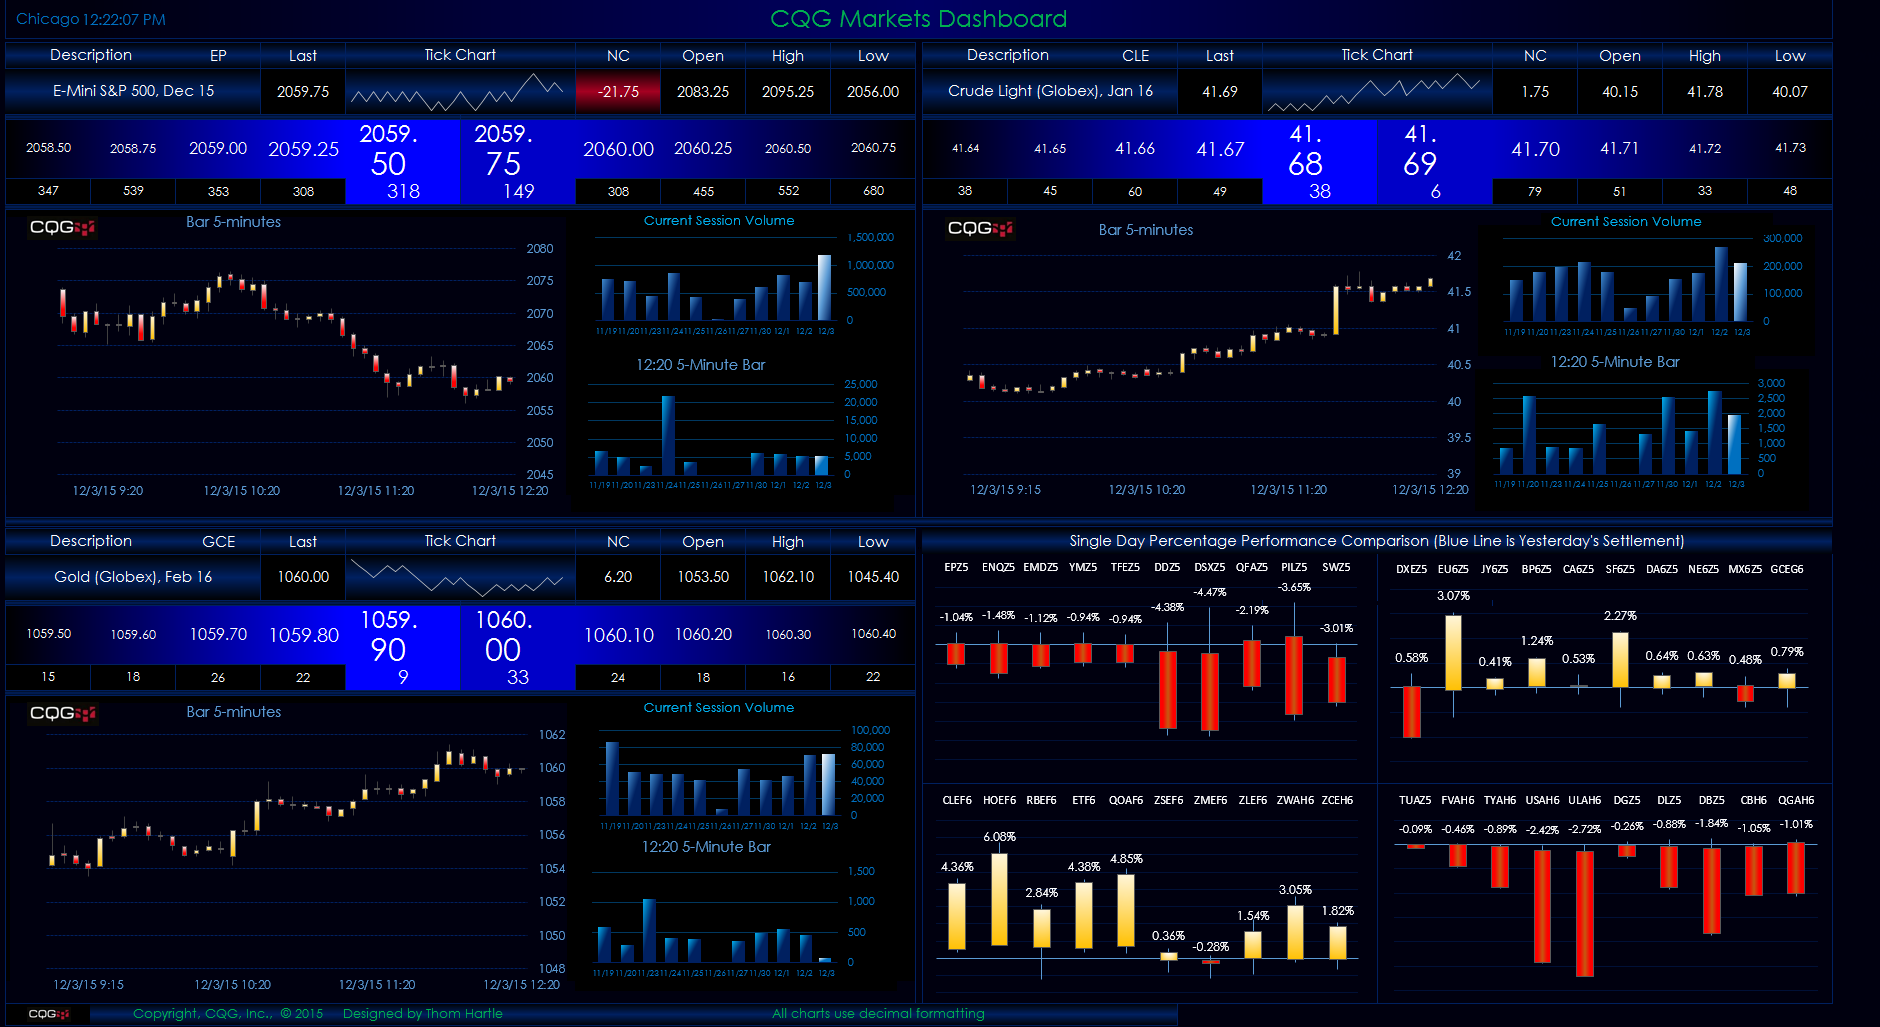
This Microsoft Excel® spreadsheet is an updated version of the CQG-Powered Excel Horizontal DOM Dashboard, which also includes a set of candlestick bars of today's performance for a portfolio of… more

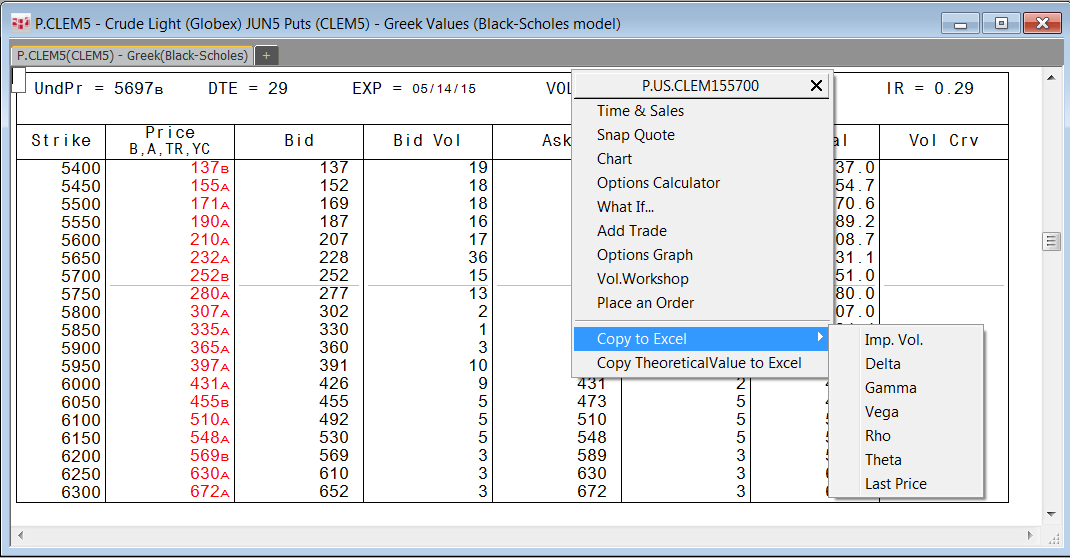
This Microsoft Excel® dashboard uses the CQG RTD OptVal formula to calculate implied volatility, theoretical value, delta, and the Greeks using data inputs from other RTD formulas.
… more
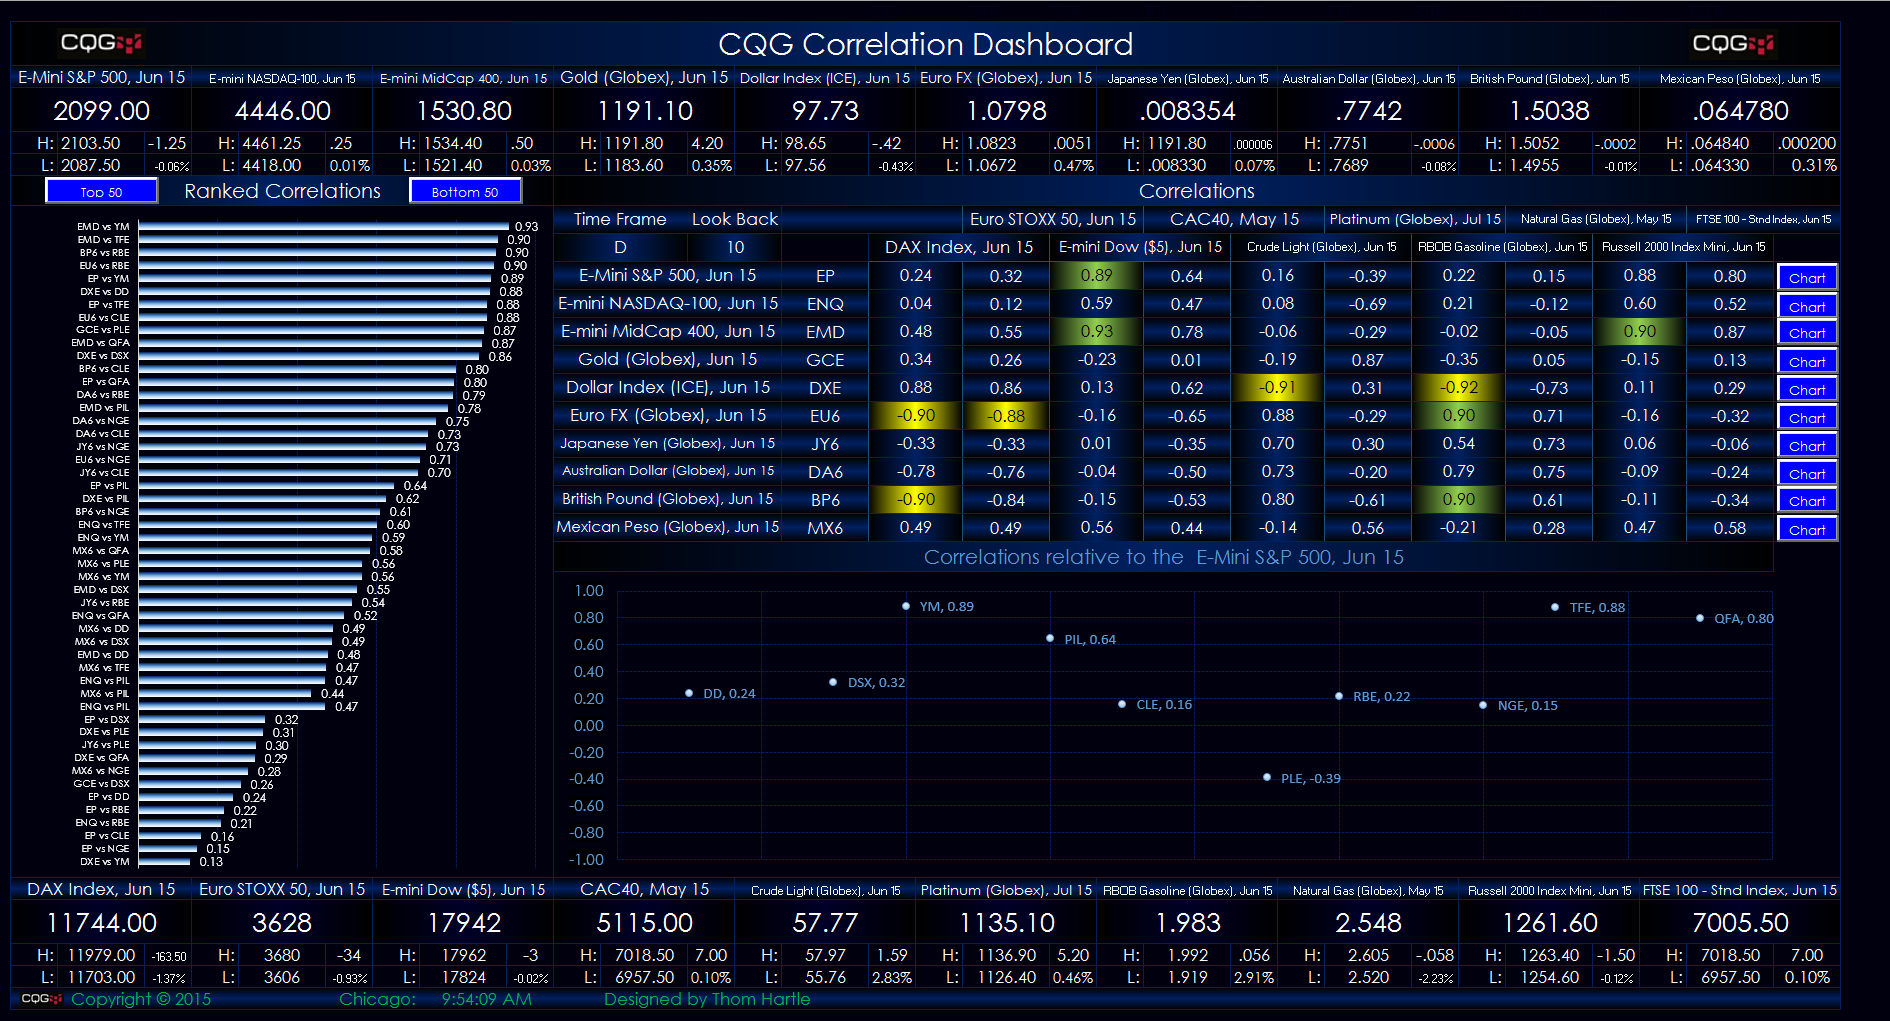
This Microsoft Excel® spreadsheet presents a 10-by-10 correlation matrix. In addition, a dynamically ranked view of the correlations from the 10-by-10 correlation matrix is displayed as histogram… more
You can use Microsoft Excel® and data from CQG to expand the features of your own market display dashboards. This powerful combination can be tailored to your specific needs. This article shows… more

If you use RTD formulas for data from the options markets, then Excel will pull data using your settings in CQG, such as the options model you have selected. An RTD formula for implied volatility… more

Options offer a wide variety of strategies for traders. CQG provides a powerful options analytics package. A number of the analytics tools, such as theoretical value, implied volatility, and the… more

This Microsoft Excel® spreadsheet uses RTD formulas to pull today's basic orders and positions information from CQG.
Orders and positions data available include:
Number of… more
This Microsoft Excel® spreadsheet offers a unique format where the current market data is displayed as borders around the chart information. The markets are heat-mapped based on percent net change… more