This Microsoft Excel® spreadsheet is an updated version of the CQG-Powered Excel Horizontal DOM Dashboard, which also includes a set of candlestick bars of today's performance for a portfolio of markets. The data is percentage adjusted, enabling you to see how markets are performing today.
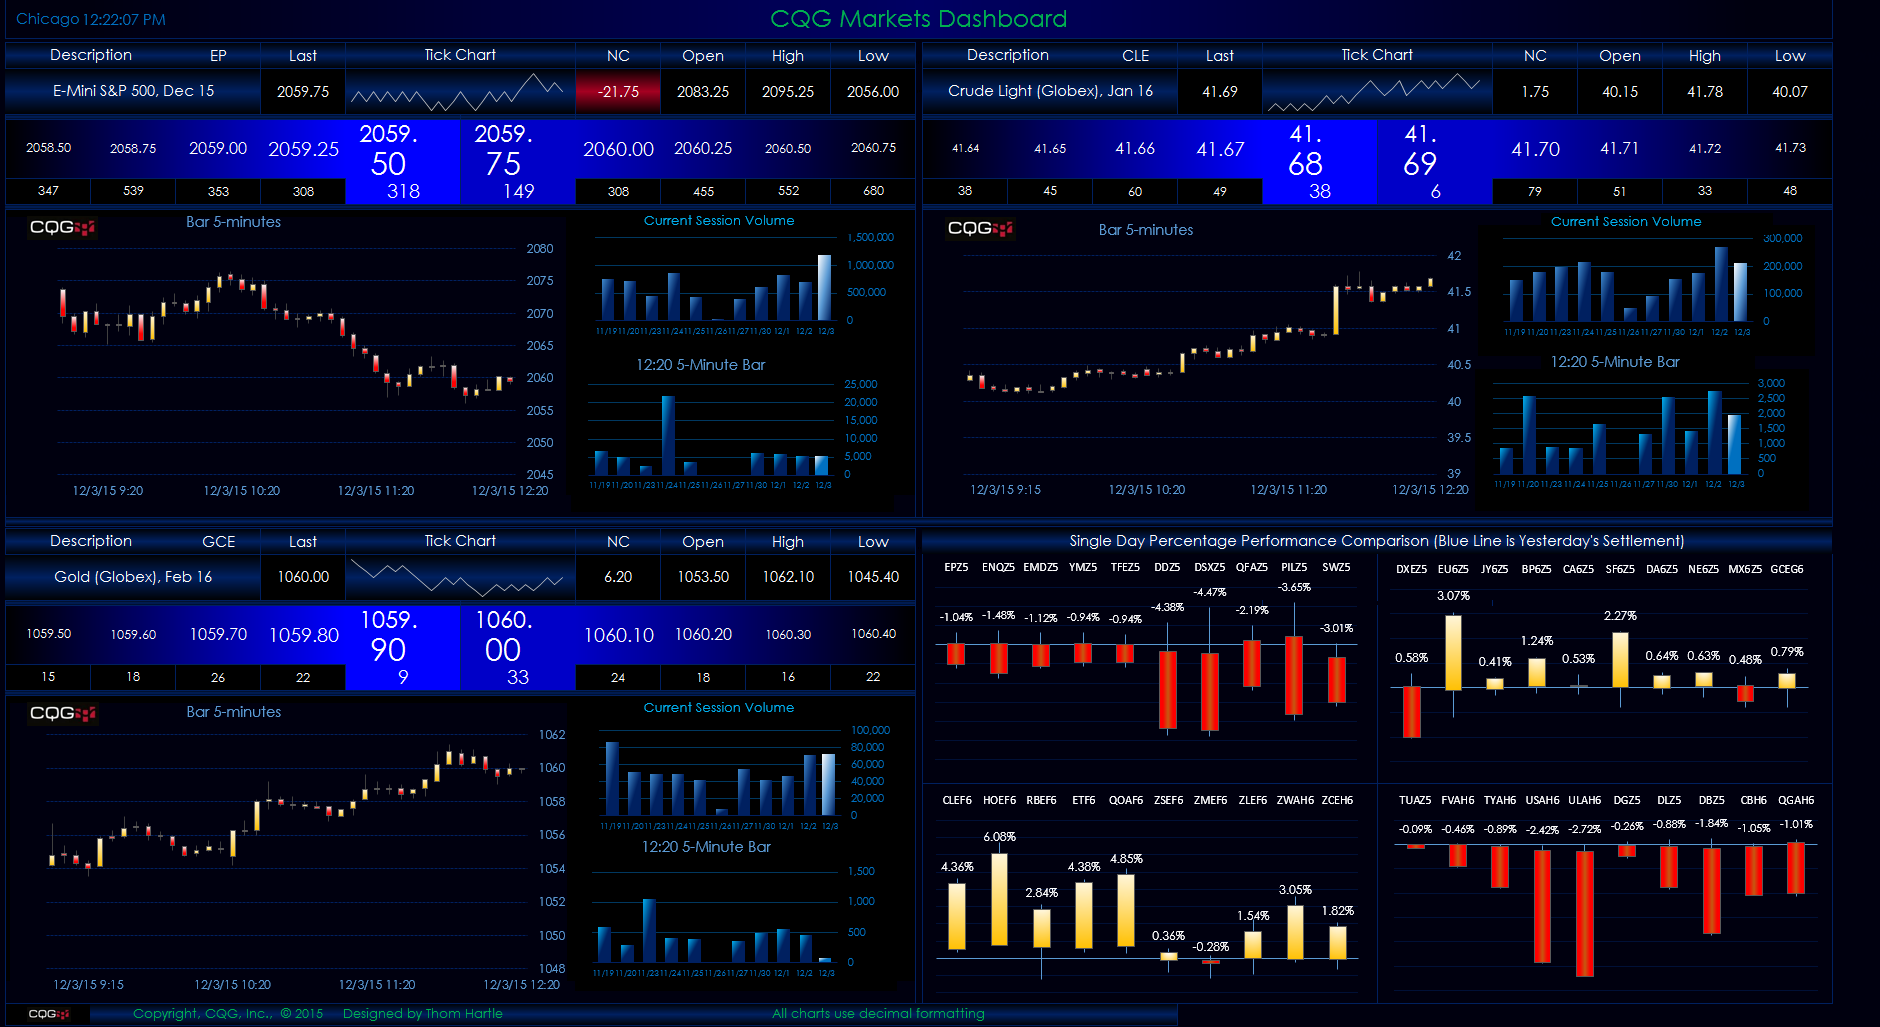
Two histogram charts have been added to each of the three chart displays. These two histogram charts display current volume (highlighted by the light blue bar) relative to volume data over the last ten sessions. The volume analysis is using five-minute bar volume.
The top histogram chart shows the current total traded volume for the session compared to the last ten trading sessions at the same current time. The bottom histogram chart shows the volume for the current five-minute bar relative to the same five-minute bar's volume over the last ten sessions.
The opening and closing times are set by the user on the Format Main Display tab.
Requires CQG Integrated Client or CQG QTrader, data enablement for the NYSE, and Excel 2013 or more recent.