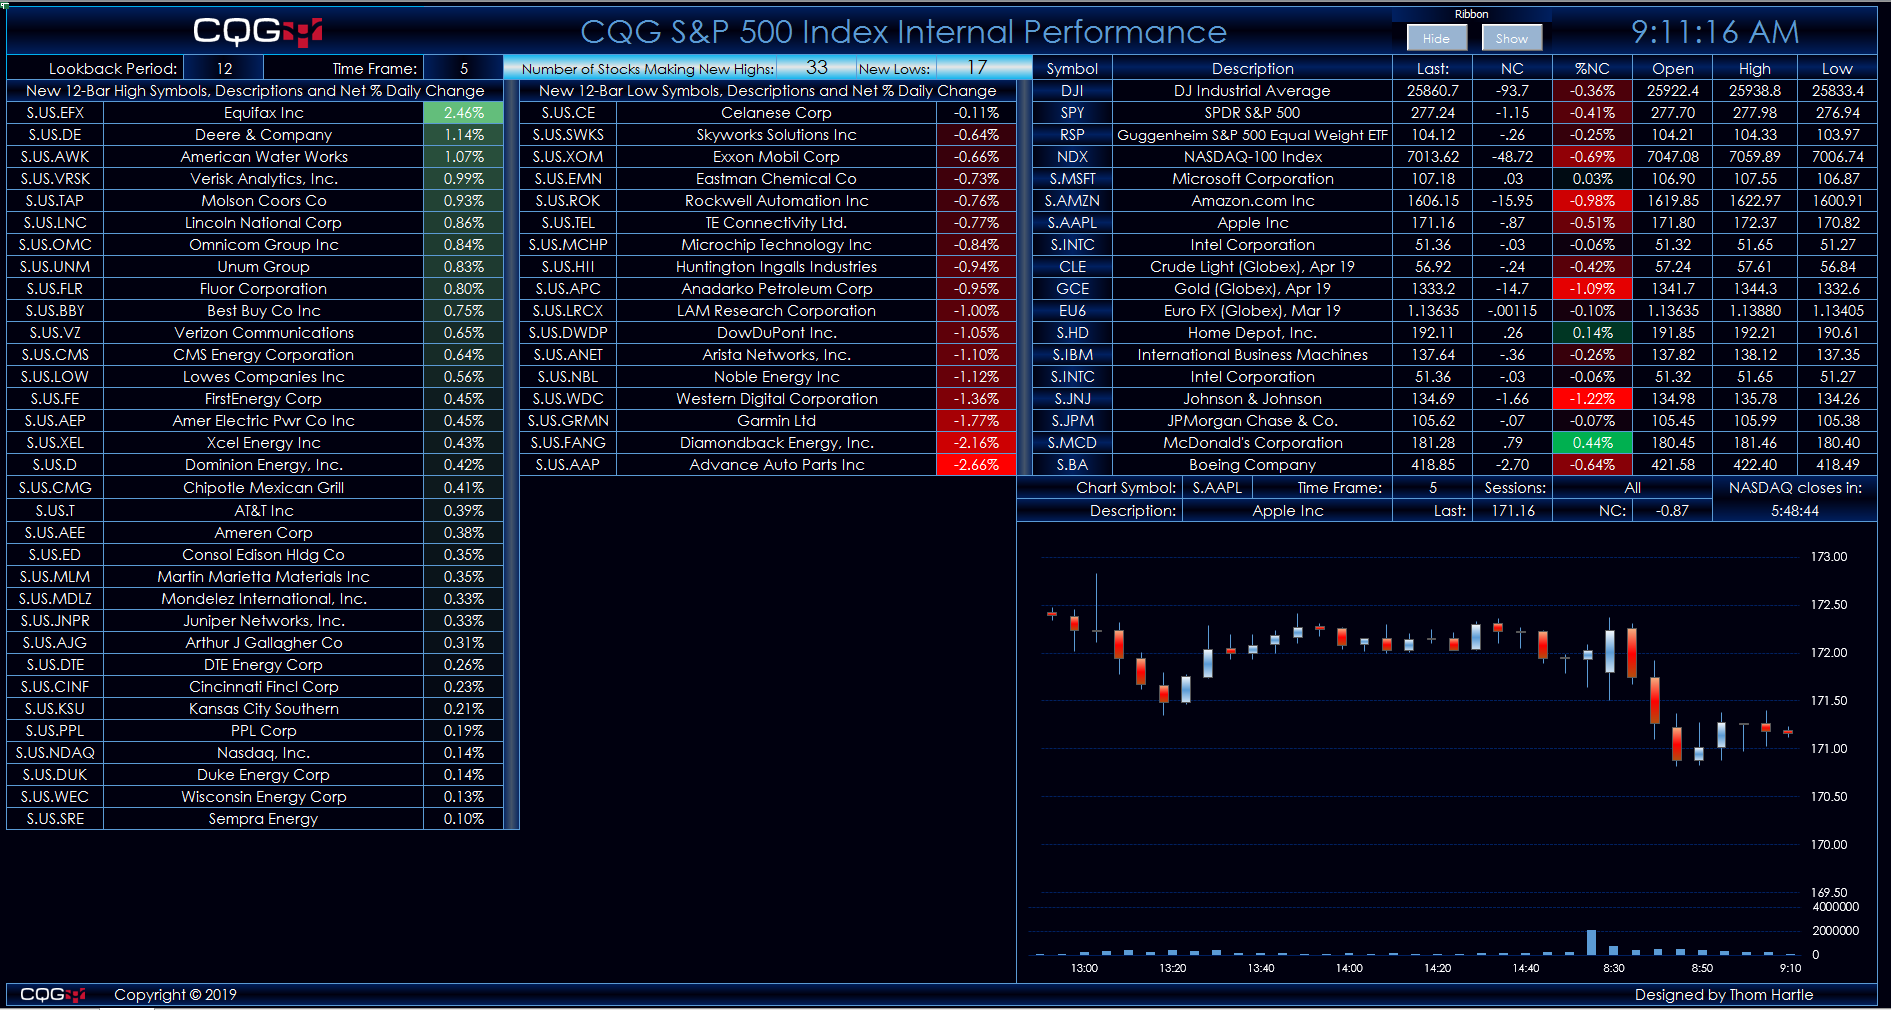
This Microsoft Excel® dashboard tracks the 506 stocks in the S&P 500 index using CQG’s Level function. The Level function plots two lines, which identify the highest and lowest price levels… more
Workspaces
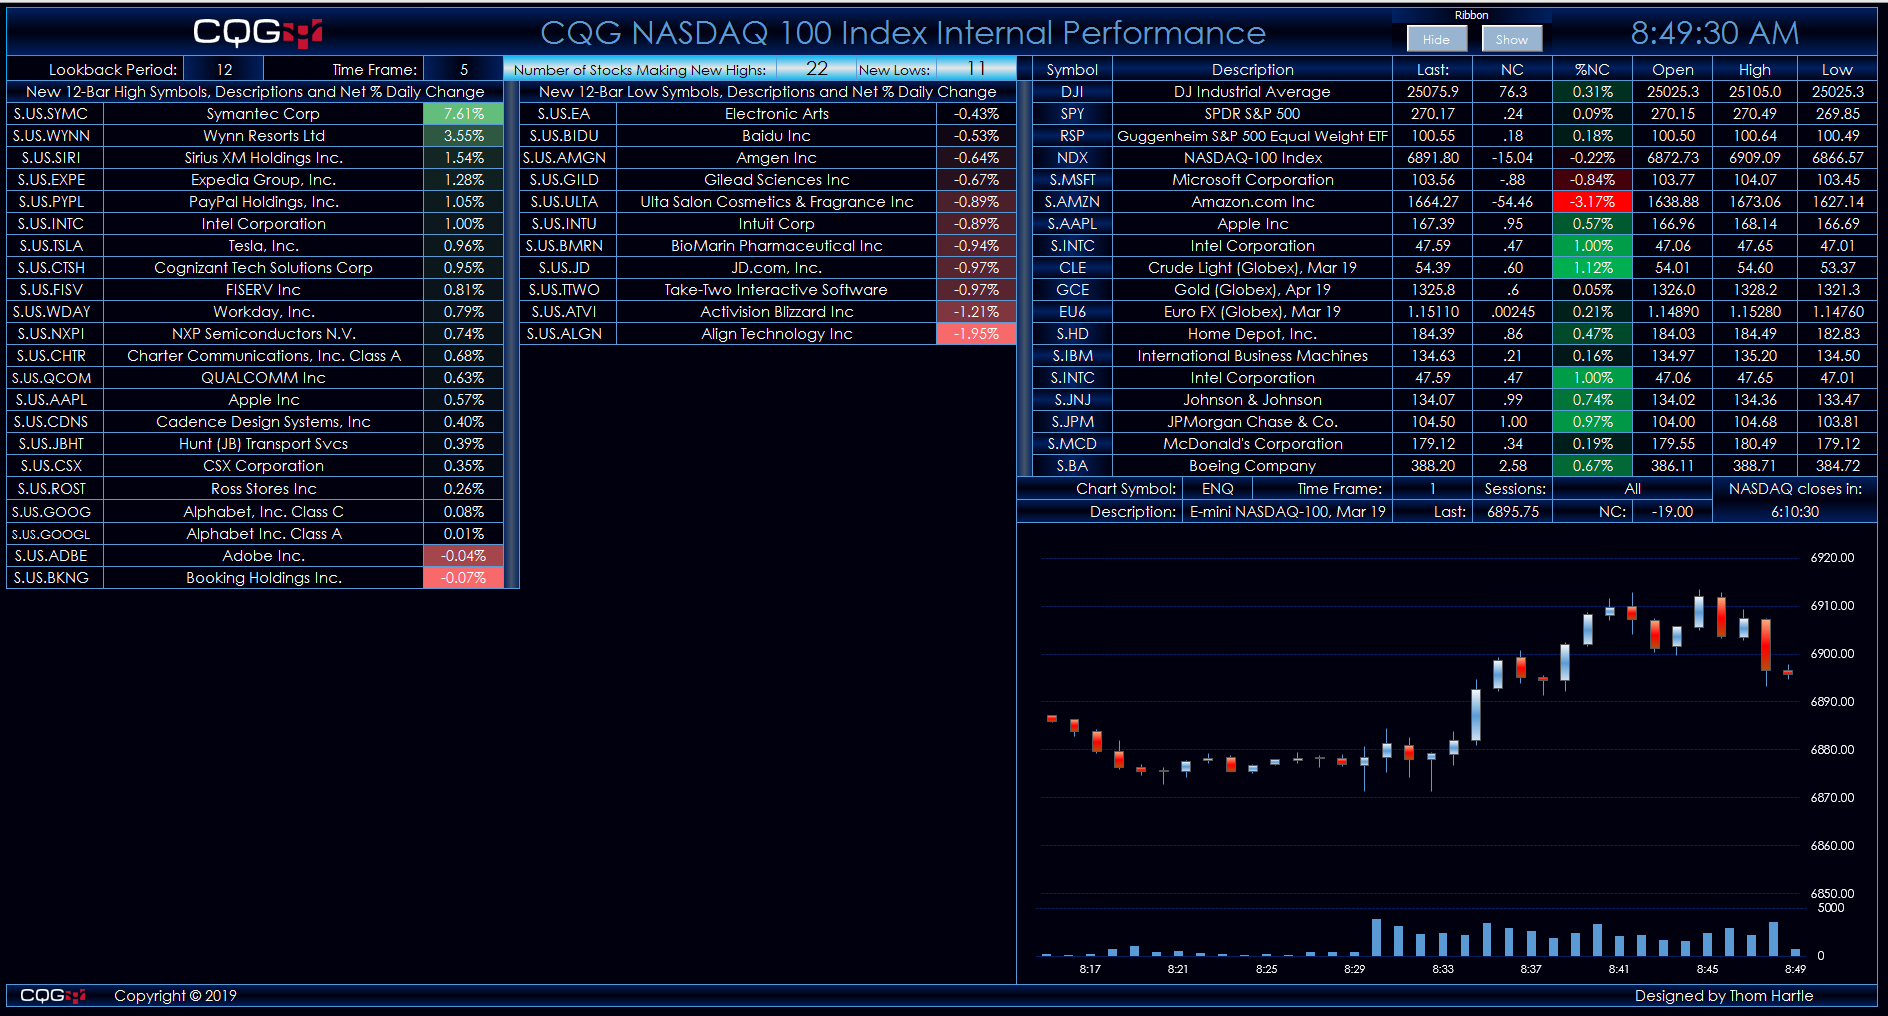
This Microsoft Excel® dashboard tracks the 104 stocks in the Nasdaq-100 index using CQG’s Level function. The Level function plots two lines, which identify the highest and lowest price levels… more
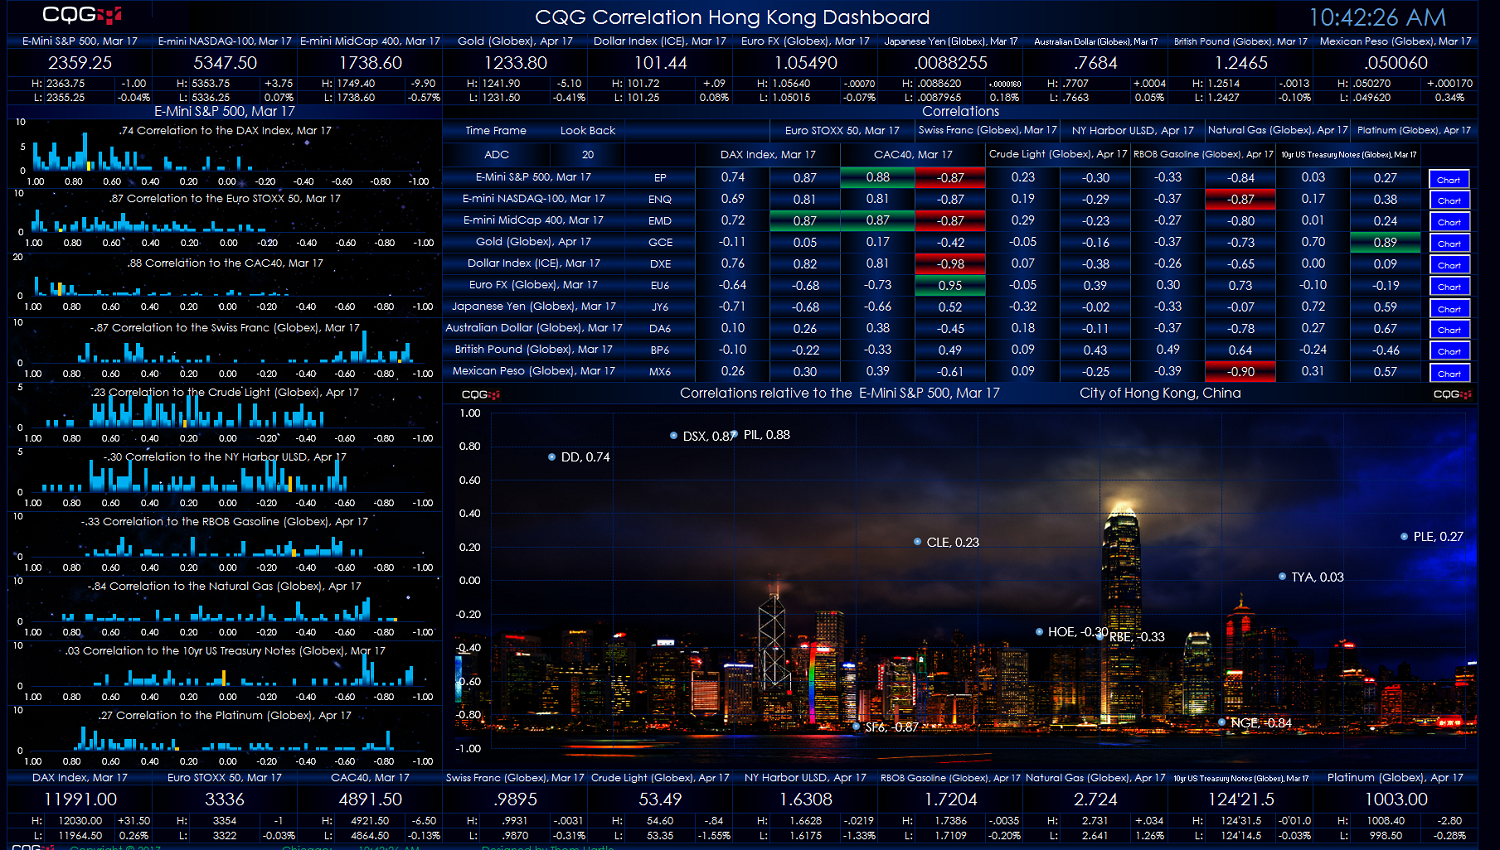
This macro-enabled Microsoft Excel® spreadsheet presents a ten-by-ten correlation matrix, a scattergram chart of the correlations by row, and frequency distribution charts of the correlations. In… more