This Microsoft Excel® dashboard tracks the 506 stocks in the S&P 500 index using CQG’s Level function. The Level function plots two lines, which identify the highest and lowest price levels attained over a defined period. The chart below shows the Level function applied to a chart using the default of 20 bars. You can see the two lines denote the highest and lowest prices for the past 20 bars.
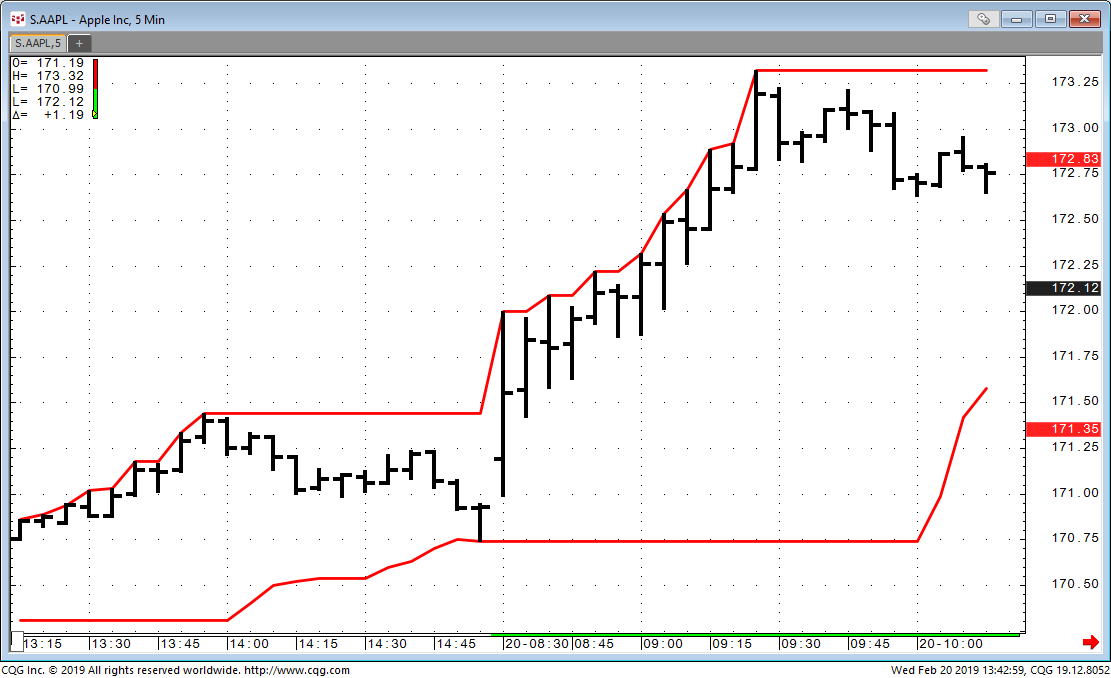
The RTD formulas for high level and the low level using a lookback of 20 bars on a 5-minute chart are:
=RTD("cqg.rtd",,"StudyData","HiLevel(EP,Period1:=20,AllowGaps:=0,InputChoice1:=High,InputChoice3:=High)"
,"Bar",, "Close","5","0",,,,,"T")
=RTD("cqg.rtd",,"StudyData","LoLevel(EP,Period2:=20,AllowGaps:=0,InputChoice2:=Low,InputChoice4:=Low)"
,"Bar",, "Close","5","0",,,,,"T")
The dashboard has two inputs in the top left-hand corner: the Lookback Period and the Time Frame.
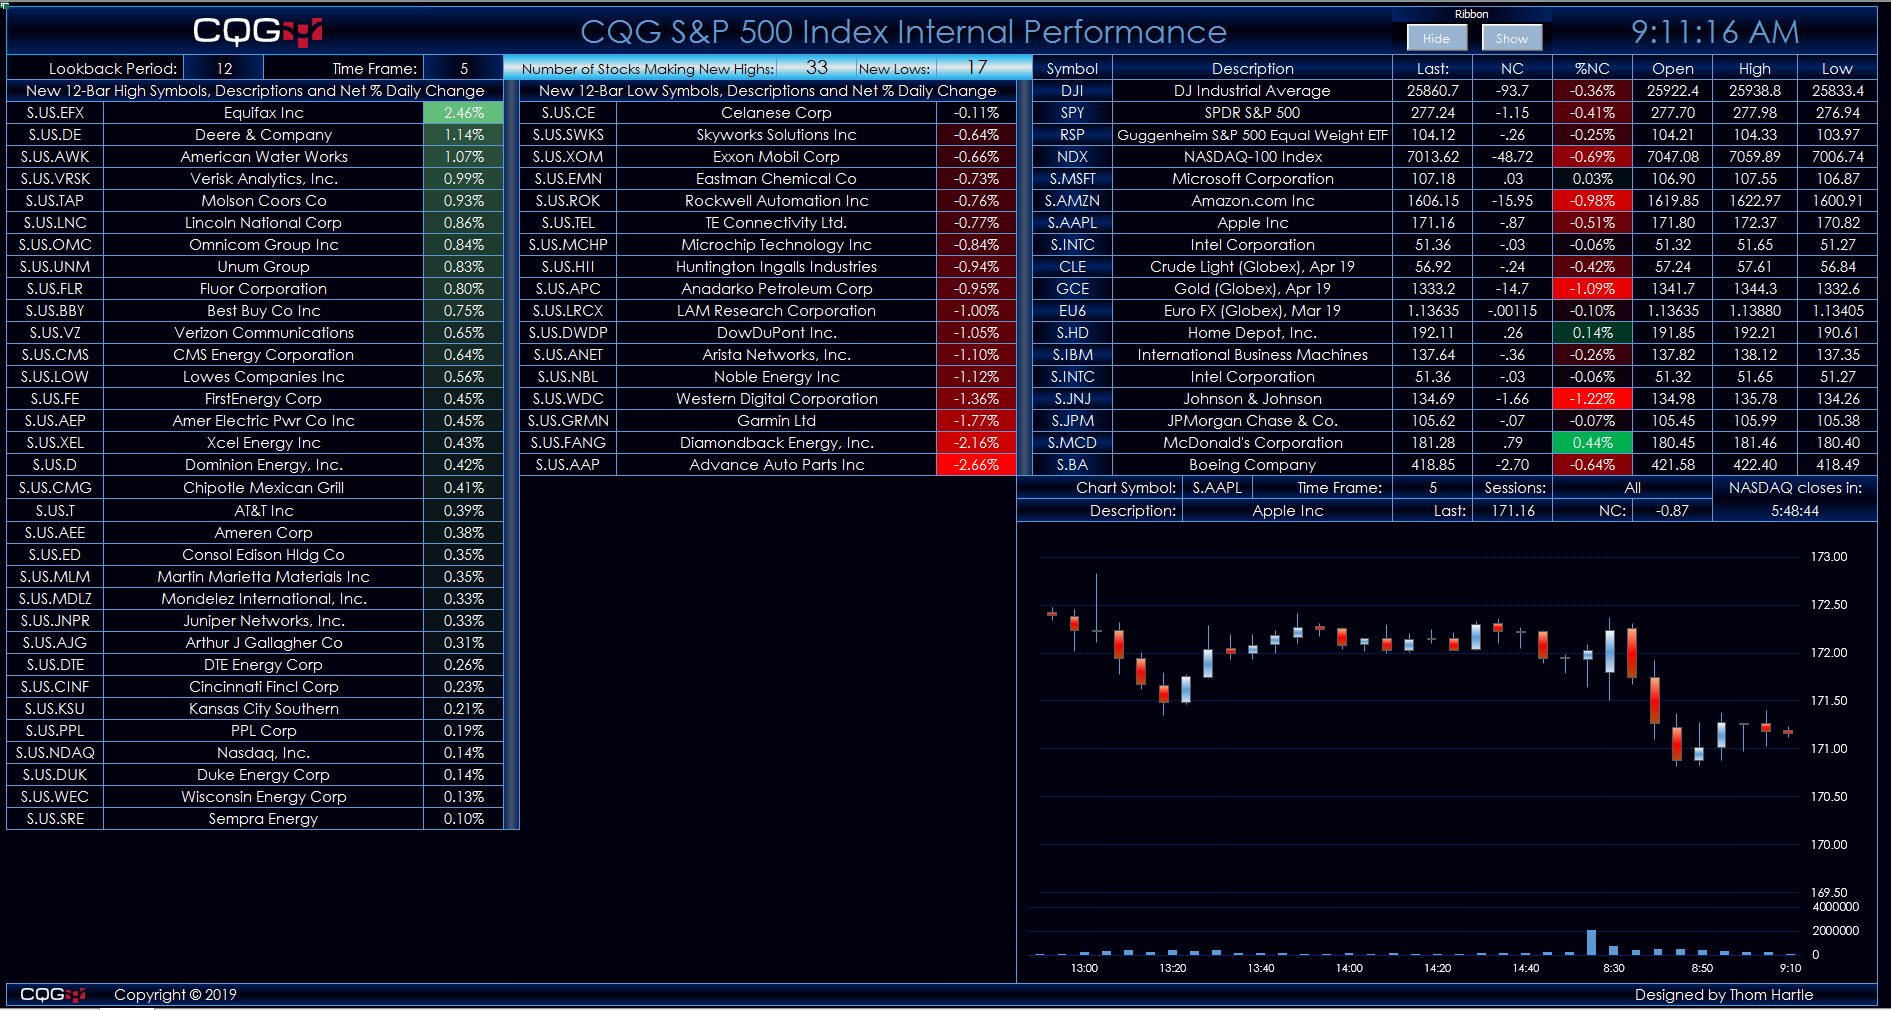
For example, if you wanted to see if any stocks in the S&P 500 Index made new 52-week highs or lows this week you enter 52 and W. Two tables will appear displaying the symbol and name of the company and the daily percent net change for stocks making new 52-week highs and new 52-week lows. The tables are sorted by today’s highest percent net change down to the lowest.
If you want to go to the other extreme, such as displaying the stocks that are making new highs using 5-minute bars over the past hour you would use 12 for the lookback and 5 for the time frame. Then, every 5-minutes the two tables will automatically update with each new 5-minute bar. This dashboard does not display historical data.
If the number of stocks exceeds 40 then you can switch to the “Ranked” tab for viewing the complete list of stocks.
On the right-hand side of the dashboard is a quotes display where you can enter in your favorite symbols. Below the quotes display is a candlestick chart. You can enter in the symbol and the time frame.
In addition, the dashboard has a Symbols tab. The constituents of the S&P 500 changes. To keep up with any new companies added or removed from the S&P 500 there is a web site where a downloadable Excel file lists the current members of the S&P 500. This is located at the State Street Global Advisors web site on the SPDR® S&P 500® ETF (SPY) page: https://us.spdrs.com/en/etf/spdr-sp-500-etf-SPY.
On this page, there is a “Holdings” tab and from that tab, you can download a text file that you can open in Excel. The text file has a column of symbols. Copy and paste that column to a new Excel file. Then merge in “S.US.” to the symbols. Then open the dashboard, select the Symbols tab and paste in the current set of symbols for the S&P 500.
Requires CQG Integrated Client, data enablements for all symbols displayed in these spreadsheets, and Excel 2010 or more recent.