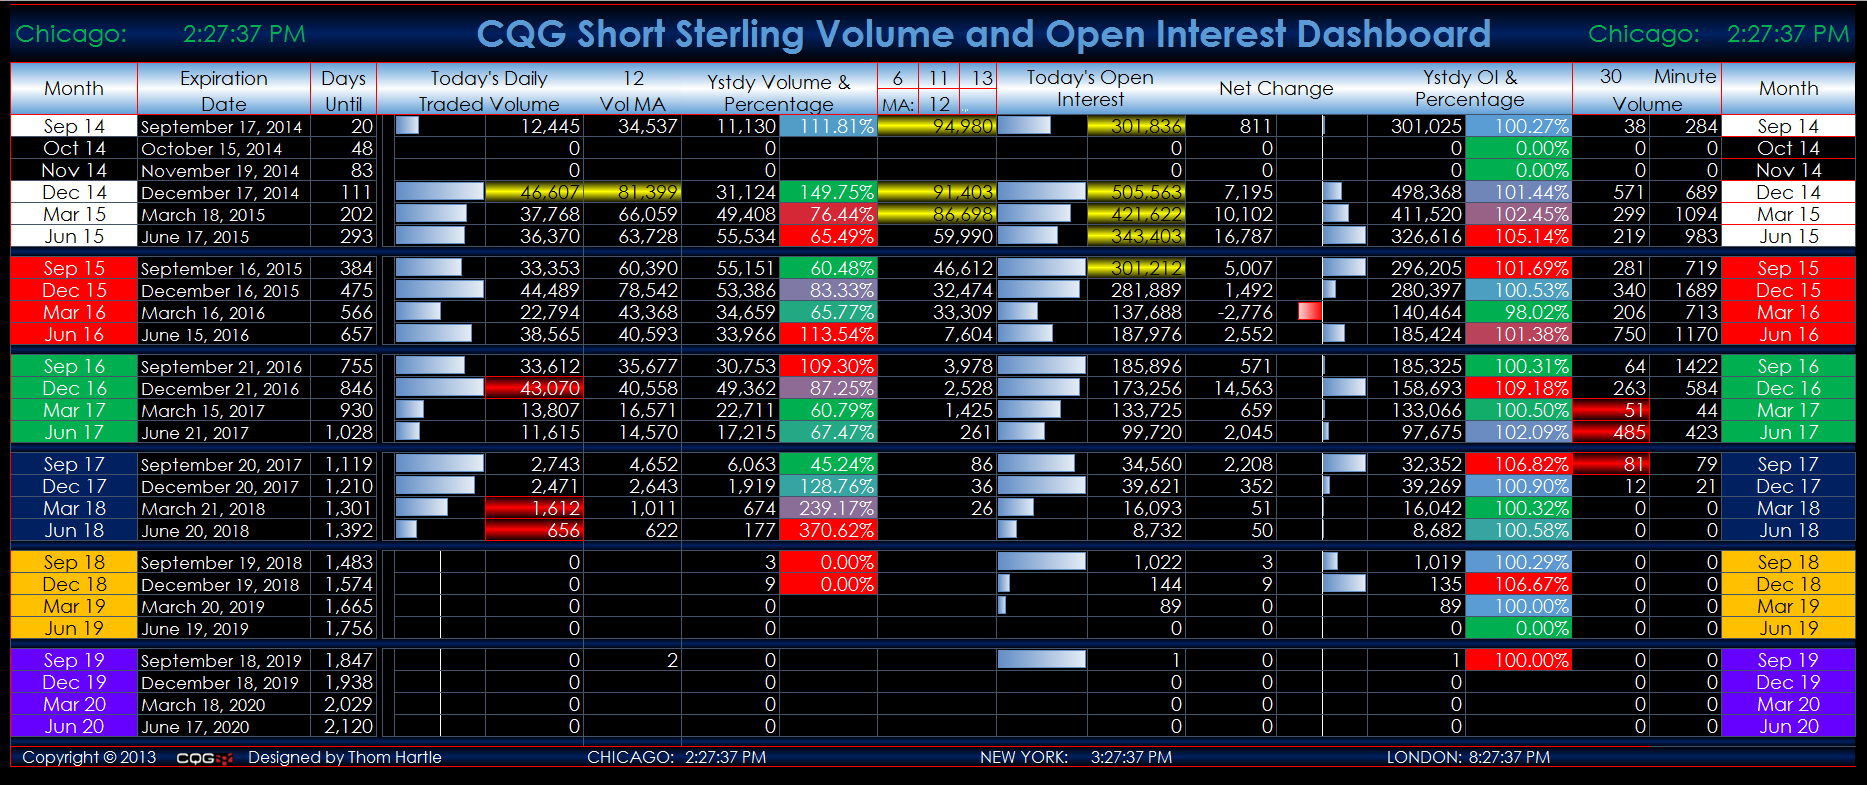
This group of Microsoft Excel® dashboards displays individual Short-Term Interest Rate (STIRs) products for tracking the rolls. All of the active deliveries for each individual symbol are… more
Workspaces

This Microsoft Excel dashboard measures volatility by using the difference between the upper and lower Bollinger Bands and dividing the difference by the Moving Average. The dashboard then sorts… more