Pie charts are a popular visual presentation used by analysts for detailing a percentage of a whole, with a circle representing the whole and slices representing the categories that make up the whole.
This post details creating pie charts in Excel using as the first example the weekly CFTC Commitment of Traders (COT) report published on Fridays. First, some details regarding the release of the COT data.
"The COT reports provide a breakdown of each Tuesday's open interest for futures and options on futures markets in which 20 or more traders hold positions equal to or above the reporting levels established by the CFTC." More information is available at the CFTC website.
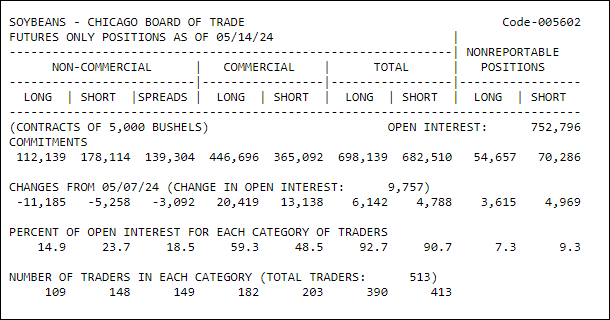
This next image is from the CFTC website. It was released on Friday, 5/17/2024 as of Tuesday, 5/14/2024.
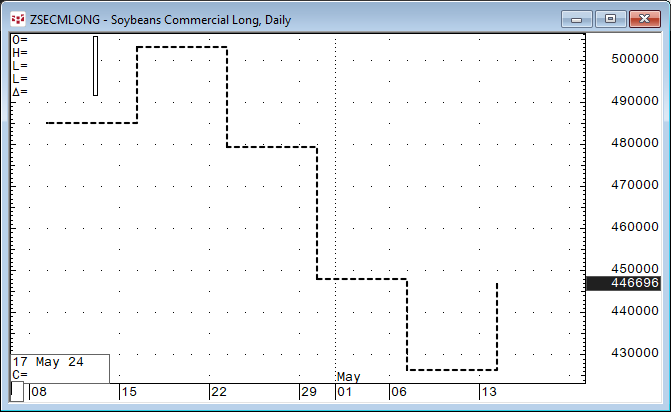
The next image is the data displayed using a daily CQG Line chart.
The latest data is for 5/14/2024 even though the data was not available until 5/17/2024. There is an issue: As this is weekly data, pulling the data into Excel using RTD calls for weekly data is only good for Friday (the release date) and up to Sunday, and then the data is now considered to be last week's data.
The solution is to use an IF THEN function and first check that if the RTD call returns a blank cell then pull last week's data, otherwise pull this week's data.
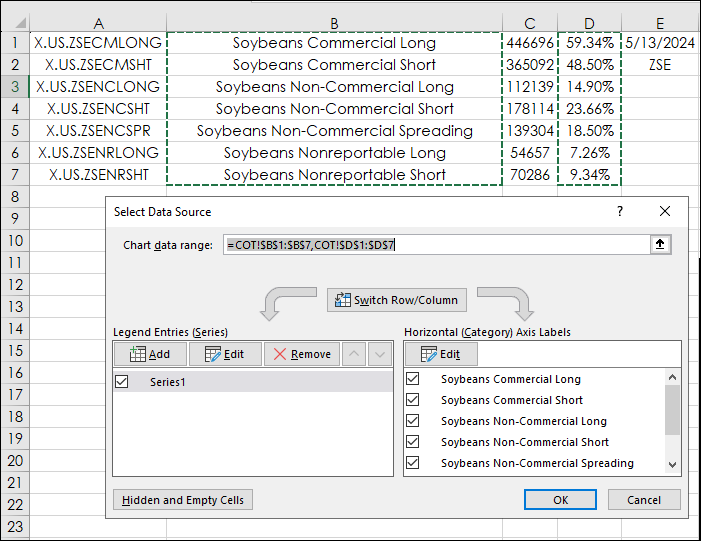
The downloadable sample spreadsheet (shown in the image below) has the symbol in column A. Column B uses an RTD function to pull in the description :
=RTD("cqg.rtd", ,"ContractData",A1, "LongDescription",, "T")And column C pulls in the current available weekly value using the IF THEN function:
=IF(RTD("cqg.rtd",,"StudyData",A1, "Bar", "", "Close","W","0",,,,,"T")="",RTD("cqg.rtd",,"StudyData",A1, "Bar", "", "Close","W","-1",,,,,"T"),RTD("cqg.rtd",,"StudyData",A1, "Bar", "", "Close","W","0",,,,,"T"))Next, the pie chart data is using the percentage of the reported positions as a ratio of the total open interest (column D). That open interest value is from Tuesday, 5/14/2024.
Using the RTD function to call Time of the weekly bar, which is the date, the function returns Monday's date. First the function checks that the current week has data otherwise use last week's date. Cell E1 uses the IF THEN function:
=IF(RTD("cqg.rtd",,"StudyData",A1, "Bar", "", "Close","W","0",,,,,"T")="",RTD("cqg.rtd",,"StudyData",A1, "Bar", "", "Time","W","-1",,,,,"T"),RTD("cqg.rtd",,"StudyData",A1, "Bar", "", "Time","W","0",,,,,"T"))Cell F2 calls the month from cell E1:
=MONTH(E1)
Cell G2 calls the day from cell E1 plus one day (Tuesday):
=1+DAY(E1)
Cell H2 calls the year from cell E1:
=YEAR(E1)
Cell E2 is the symbol for soybeans (ZSE). Cell G3 pulls the open interest for Tuesday's date:
= RTD("cqg.rtd",,"StudyData", " OI("&E2&",OIType:=commodityoi) when (LocalMonth("&$E$2&")="&$F2&" and LocalDay("&$E$1&")="&$G2&" and LocalYear("&$E$2&")="&$H2&")", "Bar", "", "Close", "D", "0", "all", "", "","FALSE","T")Column D is dividing the values in column C by the open interest in cell G3:
=C1/$G$3
To build the pie chart, first the data in cells B1:B7 are selected and pressing the Ctrl key, select cells D1:D7.
Then on the Excel Ribbon select Insert/Pie chart.
The chart will need some "Tweaking". Remove the legend along the bottom of the chart by selecting on the Excel ribbon Chart Design/Add Chart Element/Legend and select None.
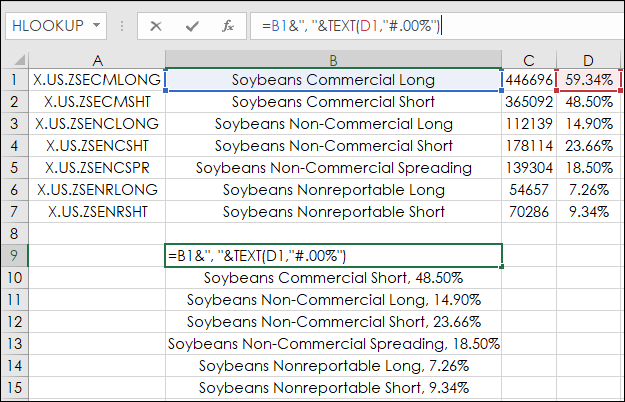
Add Chart Labels is next, but first create the chart labels by merging the description with the open interest percentage as text formatted as percentages in cells B9:B15:
=B1&", "&TEXT(D1,"#.00%")
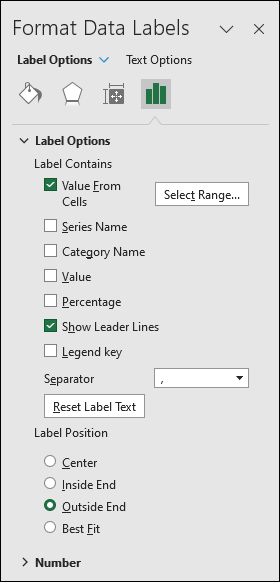
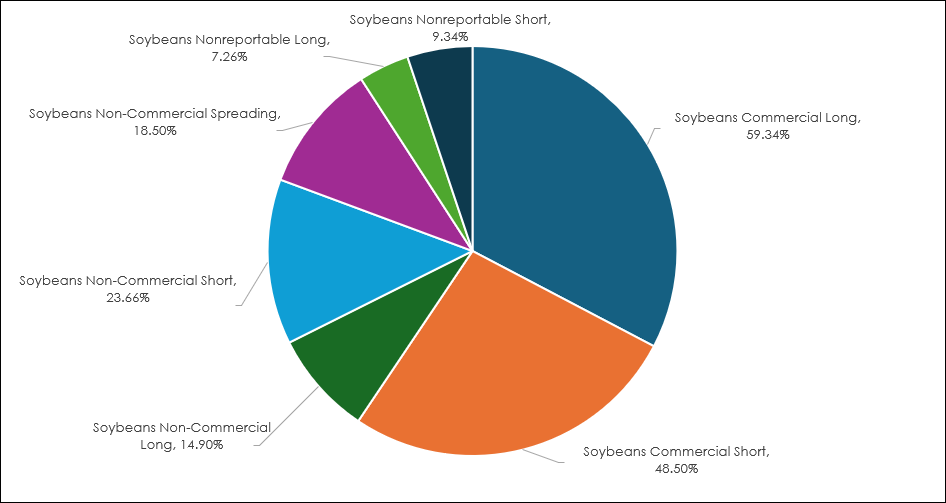
Right-click on the pie chart, select Add Data Labels near the bottom of the menu. Next, select the data labels on the chart, select Format Data Labels. Check Outside End, check Show Leader Lines, uncheck Value, check Values From Cells, Select Range, which is cells B9:B15.
Now, manually select the Data Labels and resize them.
Next, examples of building pie charts to review the sector composition of two ETFs: The SPDR S&P 500 ETF (symbol: SPY) and Invesco's ETF that tracks the Nasdaq-100® Index (symbol: QQQ). The data is from 5/17/2024.
One source for the data is Fidelity Investments' website. This link is for the sector exposure of the SPY ETF and this link is for the sector exposure of the QQQ ETF.
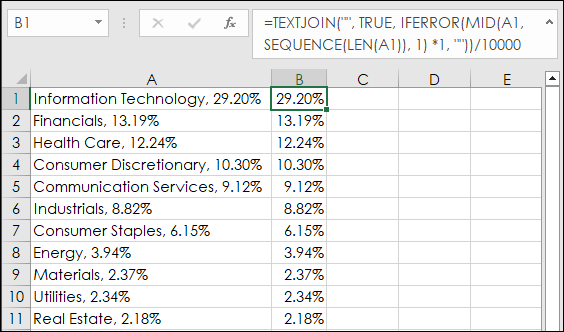
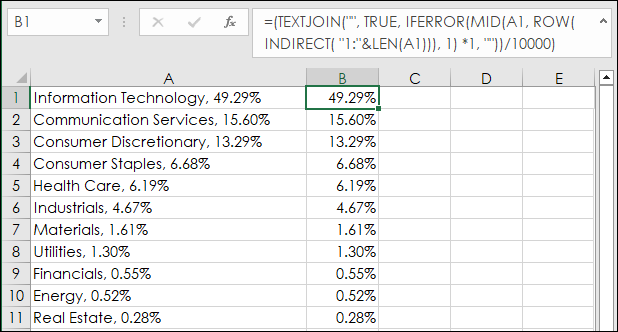
Copying the tables and pasting the data into Excel will result in all text for the percentage exposure for each sector, as seen in cells A1:A11. But the pie chart requires values to determine the slices of the pie chart. This Excel function (requires Excel 365 or higher) will search for values and will remove the text. The function is courtesy of ablebits.com.
The values returned are integers, so the TEXTJOIN function is divided by 10000 and formatted as percentages for cells B1:B11:
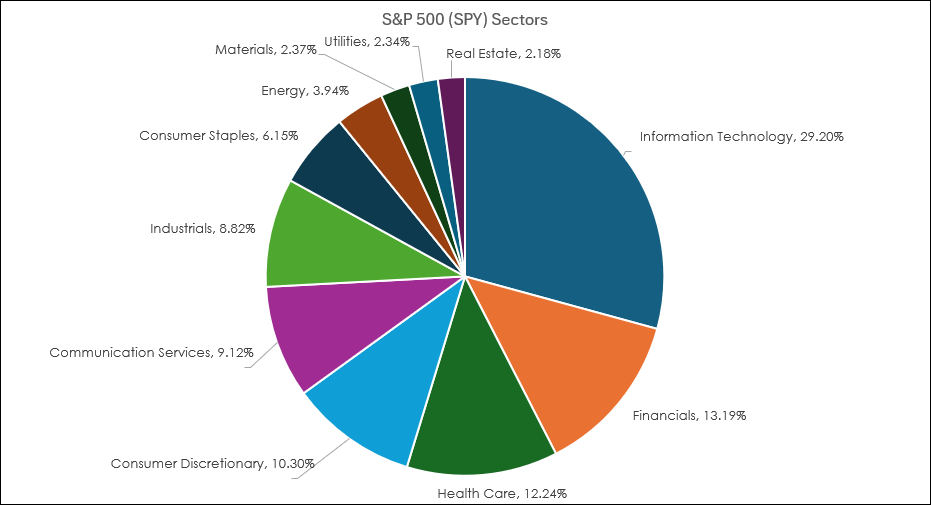
=TEXTJOIN("", TRUE, IFERROR(MID(A1, SEQUENCE(LEN(A1)), 1) *1, ""))/10000Following the steps for the COT pie chart will result in this pie chart for the sector composition analysis of the SPY ETF. Currently, the Information Technology sector is the largest with the ETF having a 29.20% exposure.
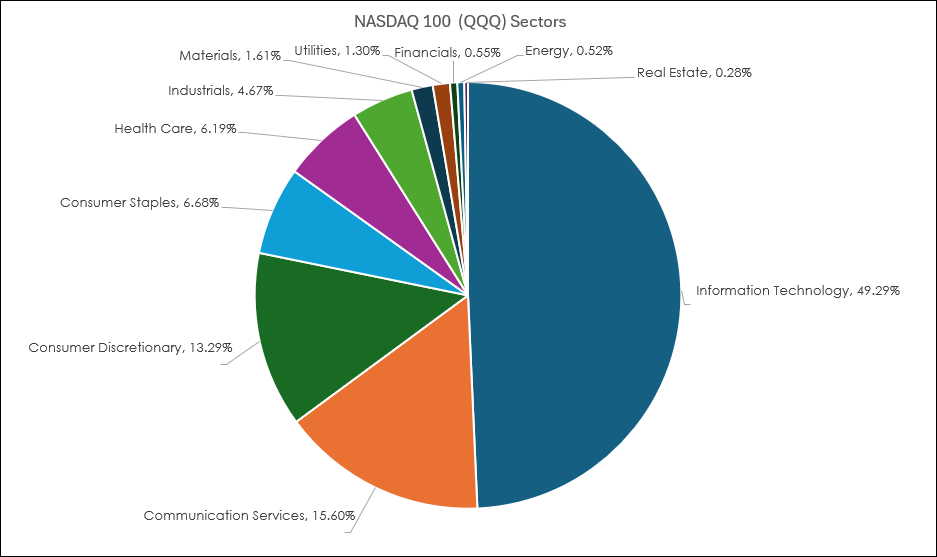
Following the same steps for the SPY ETF using the sector exposure for the QQQ ETF results in this table and pie chart.
The QQQ ETF has a 49.29% exposure to the Information Technology sector.
This post detailed the steps to building pie charts using data brought into Excel via RTD calls or simply copying and pasting data from an outside source. If there is an interest in pulling historical COT data for display on a CQG chart this link is to a post with a downloadable CQG PAC.
Requirements: CQG Integrated Client or QTrader, and Excel 365 (locally installed, not in the Cloud) or more recent.
