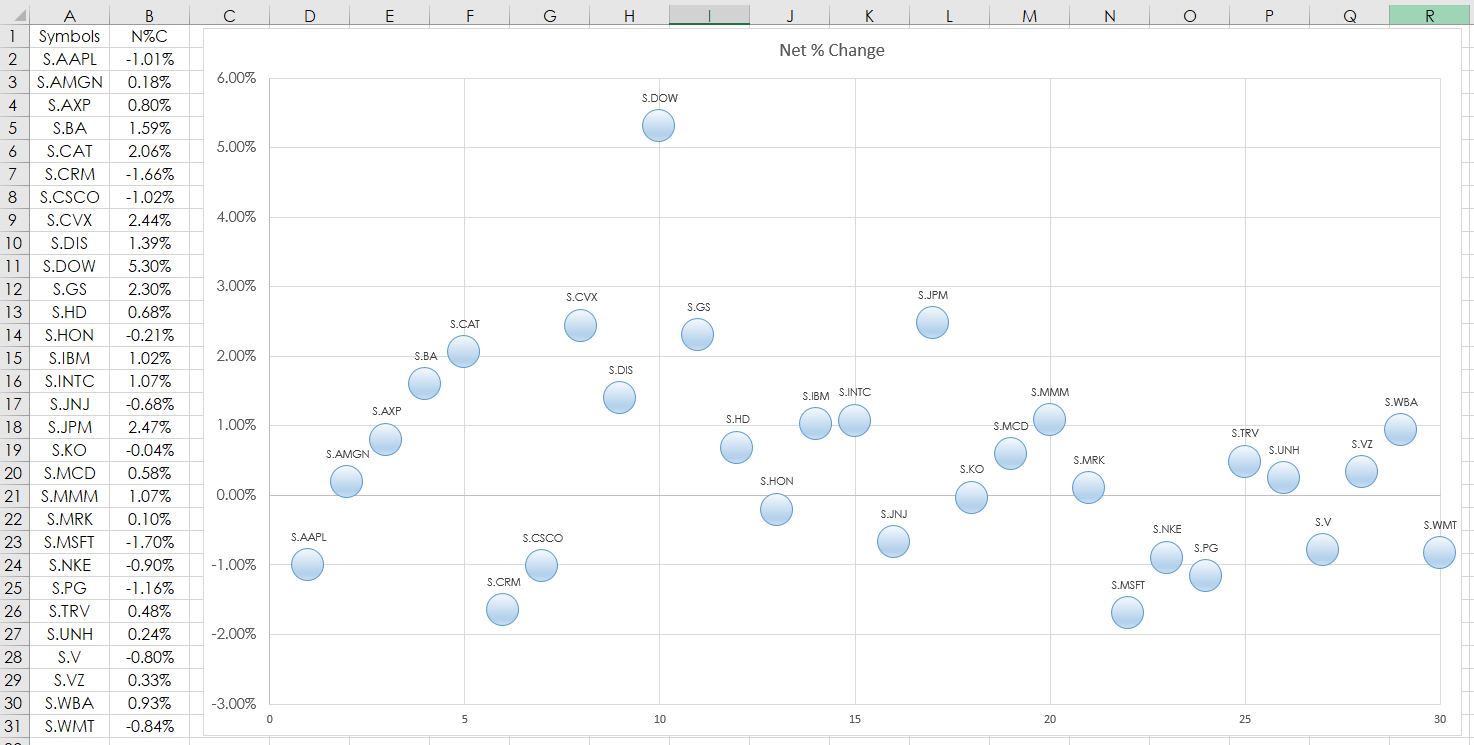
This post details using the Microsoft® Excel “Scatter Plot” Chart to track market performance. In this example, RTD formulas are used to pull in the percent net change of the 30 stocks that are in… more
This post details using the Microsoft® Excel “Scatter Plot” Chart to track market performance. In this example, RTD formulas are used to pull in the percent net change of the 30 stocks that are in… more