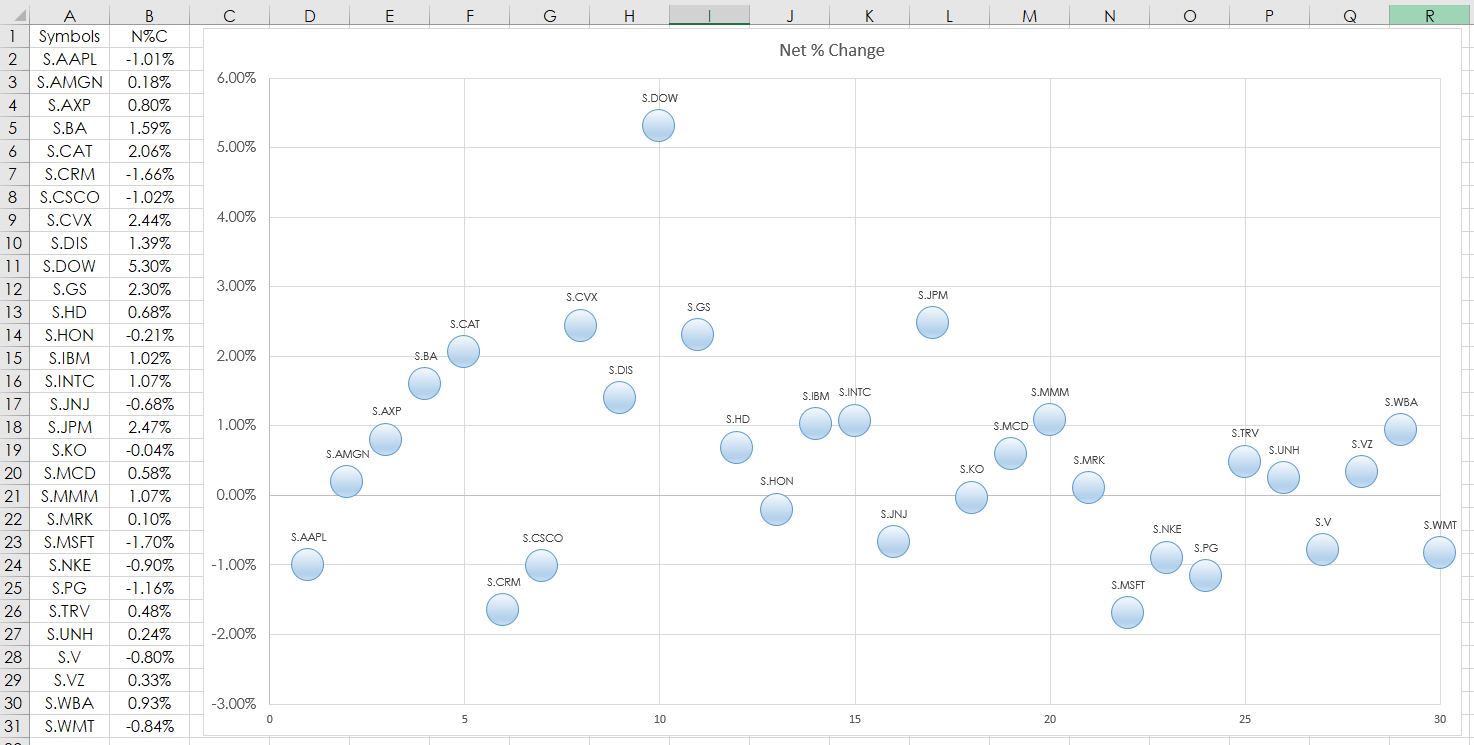
This post details using the Microsoft® Excel “Scatter Plot” Chart to track market performance. In this example, RTD formulas are used to pull in the percent net change of the 30 stocks that are in… more
Workspaces
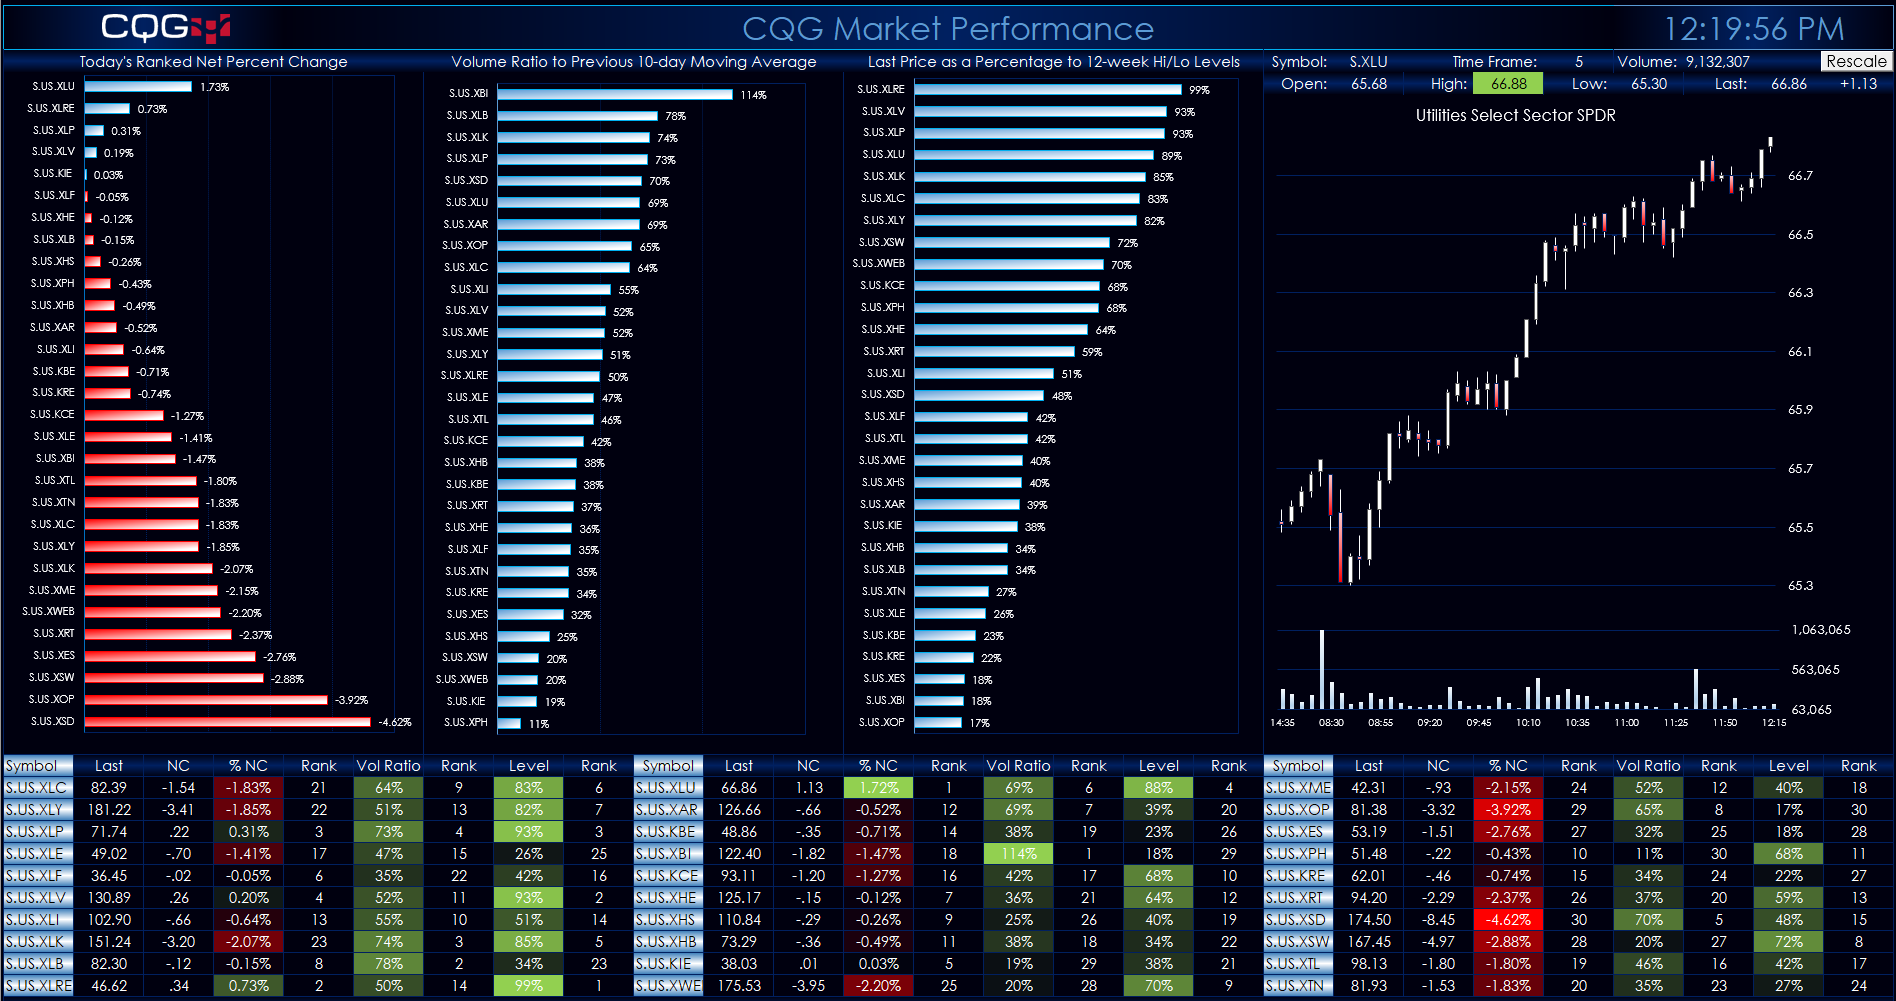
This Microsoft® Excel Dashboard comes frontloaded with 30 Sector and Industry symbols. However, you can enter in whatever symbols you like using the Symbols tab. The long description of the symbol… more
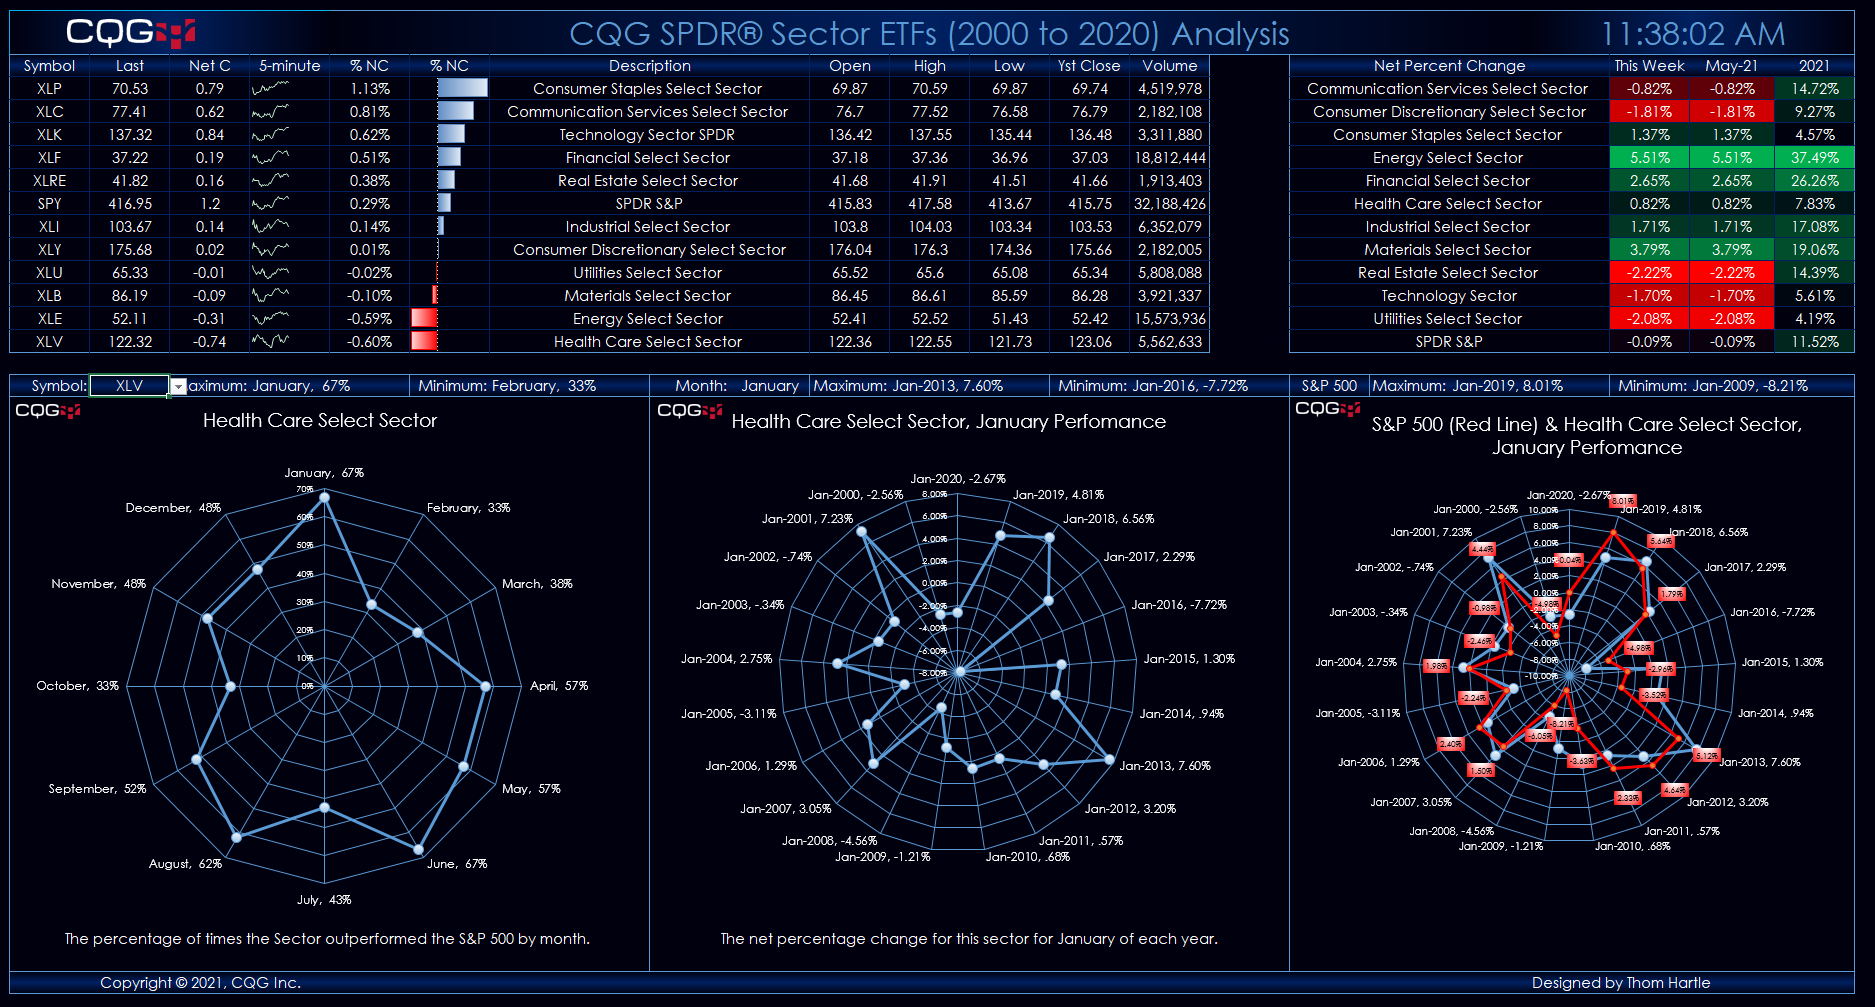
SPDR® Sector ETFs Analysis Dashboard This Microsoft® Excel dashboard provides analysis of S&P Sectors based on ETFs. The collection of ETFs are:
Symbol Description XLC Communication… more
Customers using our flagship product, CQG Integrated Client (CQG IC), have access to a new study called Algo Orders. Using a proprietary algorithm, this trading activity indicator detects and… more