SPDR® Sector ETFs Analysis Dashboard This Microsoft® Excel dashboard provides analysis of S&P Sectors based on ETFs. The collection of ETFs are:
| Symbol | Description |
|---|---|
| XLC | Communication Services Select Sector |
| XLY | Consumer Discretionary Select Sector |
| XLP | Consumer Staples Select Sector |
| XLE | Energy Select Sector |
| XLF | Financial Select Sector |
| XLV | Health Care Select Sector |
| XLI | Industrial Select Sector |
| XLB | Materials Select Sector |
| XLRE | Real Estate Select Sector |
| XLK | Technology Sector |
| XLU | Utilities Select Sector |
These ETFs plus the S&P 500 SPDR (SPY) are displayed in the quote display in the top left corner of the dashboard. This quote display is dynamically ranked in real time.
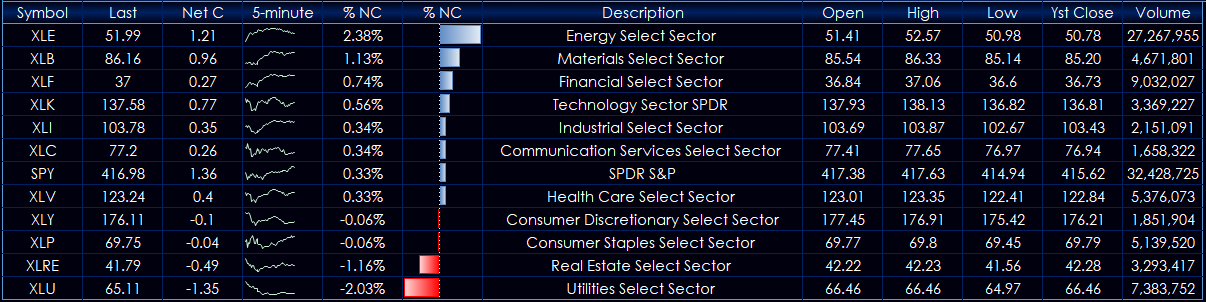
The quote display includes a 5-minute sparkline chart detailing the current session’s price action.
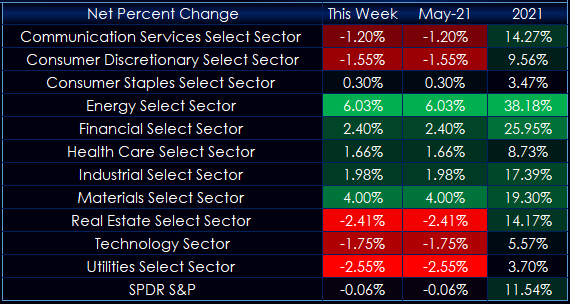
The quote display in the top right corner lists the current net percent change for the week, month, and year for each ETF.
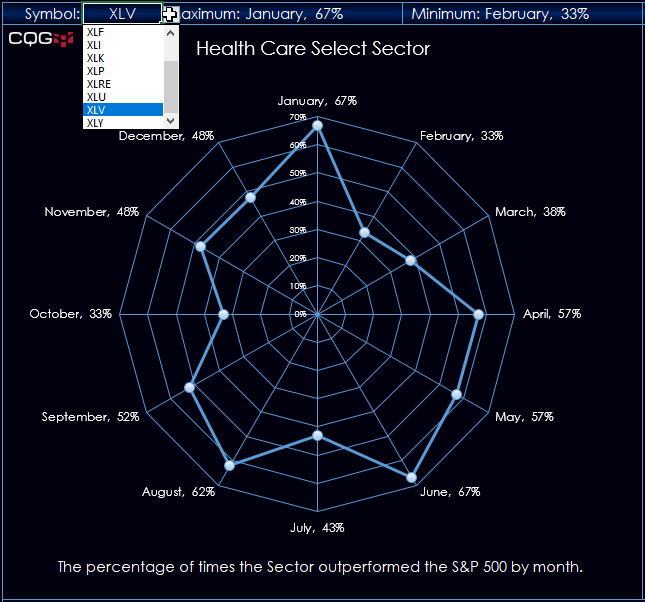
Along the bottom of the dashboard are three Excel Radar Charts. The first one has a dropdown menu to select the symbol. This radar chart displays the percentage of time the chosen sector has outperformed the S&P 500 during each month from 2000 to 2021. For example, the Healthcare sector outperformed the S&P 500 67% of the time during the month of January. While the Healthcare sector outperformed the S&P 500 only 33% of the time during February.
The second radar chart also has a dropdown menu to select the month to view the performance from 2000 to 2021. Here you see the percent change performance for the selected ETF by month and year.
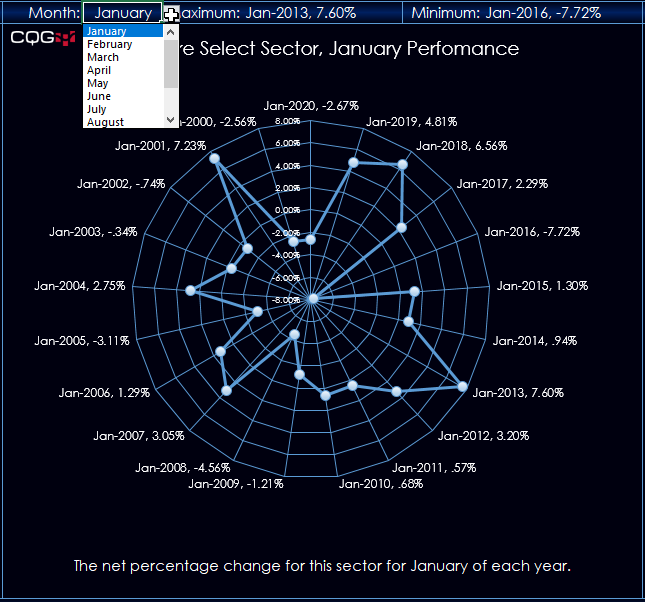
The final radar chart is the same as the second radar chart with the addition of the performance of the S&P 500 as an overlay (red line and red callouts) for comparing performance.

If you would like to see this chart type in CQG Desktop then click this link and vote for the suggestion. CQG Customer Feedback: Radar Charts
Requires CQG Integrated or QTrader. Strongly recommended: Microsoft Office Professional Excel 2016, 2019, 32 or 64-bits installed on your computer, not in the Cloud.