This Microsoft® Excel Dashboard comes frontloaded with 30 Sector and Industry symbols. However, you can enter in whatever symbols you like using the Symbols tab. The long description of the symbol is displayed on the Symbols tab. Be sure to use “S.” before the core symbol, such as “S.MSFT” and always use capital letters.
The dashboard has four charts: three histogram bar charts and an O-H-L-C bar candle stick chart with volume.
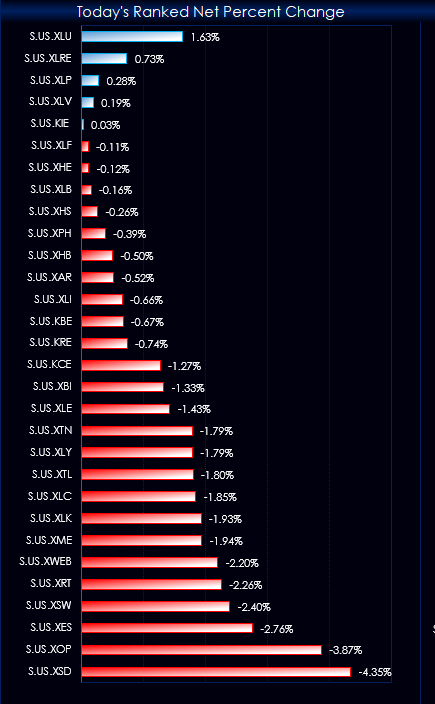
The first histogram bar chart displays today’s net percent change ranked from high to low. This chart is using the Excel techniques described in this post.
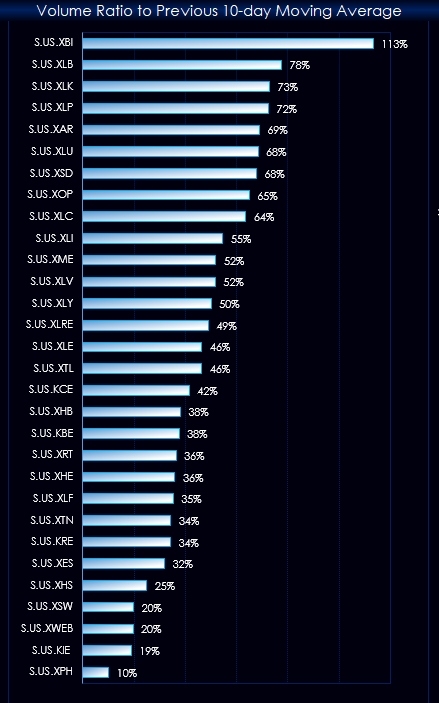
The second chart is also using the ranking feature, but it ranking the ratio of today’s volume compared to yesterday’s 10-day moving average of the volume. The symbols at the top may be experiencing unusually high volume.
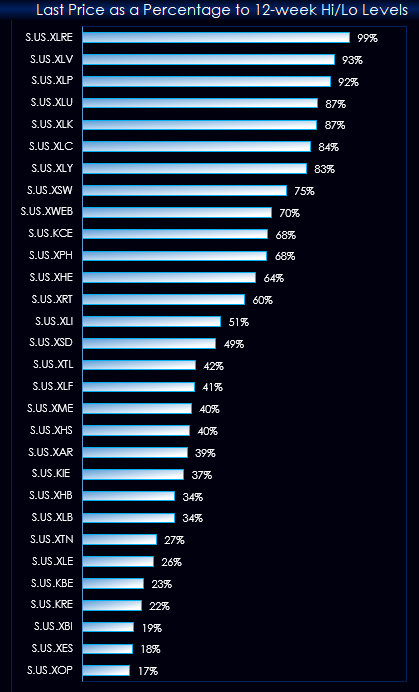
The third histogram bar chart is comparing the relative position as a percentage of the last price with the rolling 12-week high and low. The symbols at the top of the chart are in uptrends.
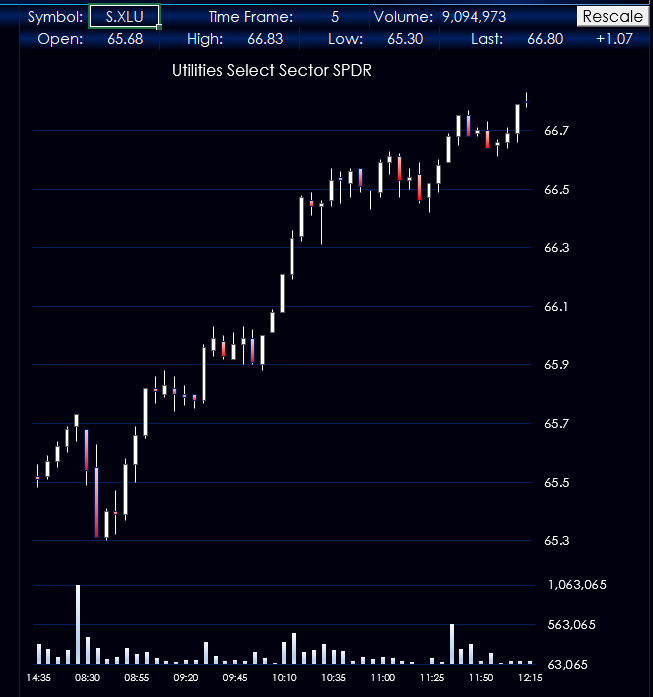
The last chart allows you to enter in the symbol and the time frame. Give it a few seconds for the data to be pulled into Excel then hit “Rescale.” Excel tends to default the charts to zero for the lowest price. The Rescale macro will fit the scale. If the price action on the chart goes out of range, simply hit Rescale again. At the bottom of the dashboard, you can enter in “All” for the entire session or “PrimayOnly” for the day session.
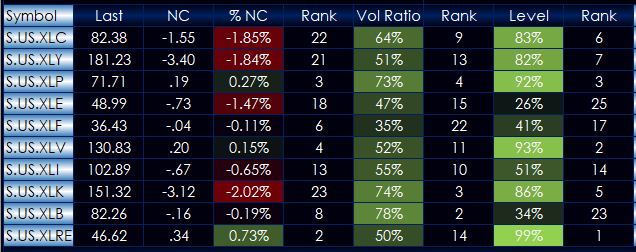
The bottom quote display section is the three groups from the Symbols tab. The Last Price, Net Change, and Percent Net Change. The Rank column next to %NC is today’s rank among the 30 symbols. The Vol Ratio column is today’s volume as a ratio to the previous day’s 10-day moving average of the volume. The Rank column is where each symbol is ranked in the group of 30 symbols. The Level column is where the last price as a percentage of the rolling 12-week high and 12-week low. The Rank column is the symbols performance relative to the group of 30 symbols.
Requires CQG Integrated or QTrader. Strongly recommended: Microsoft Office Professional Excel 2016, 2019, 32 or 64-bits installed on your computer, not in the Cloud.