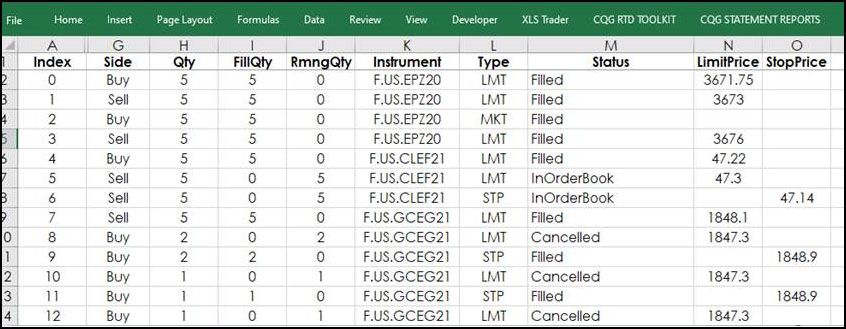
The CQG RTD Toolkit Add-in has been updated. This updated Excel add-in is automatically installed with CQG IC 21-12-8042 Beta and higher. The updates are to the Orders and Positions tabs. New… more
Workspaces
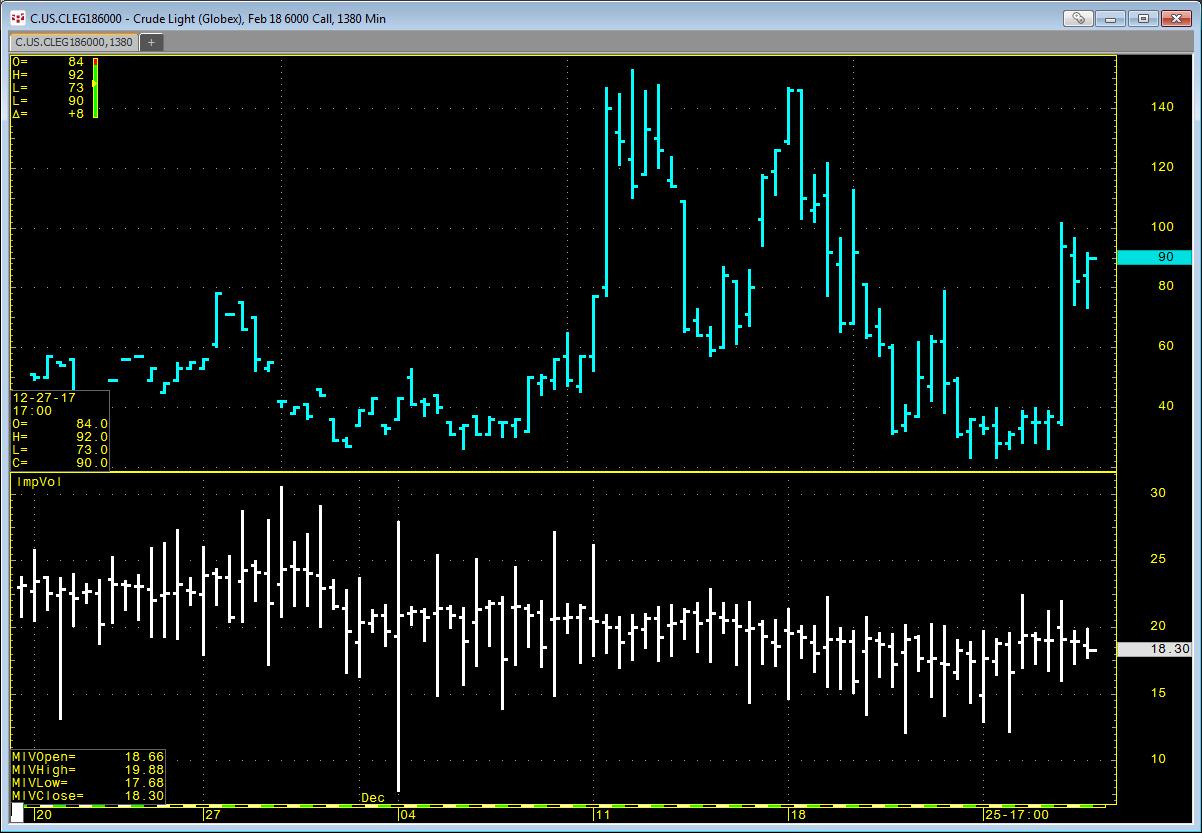
CQG offers an Implied Volatility (ImpVol) study that allows you to pull in historical implied volatility data onto a chart. ImpVol is not the implied volatility of one particular option.… more
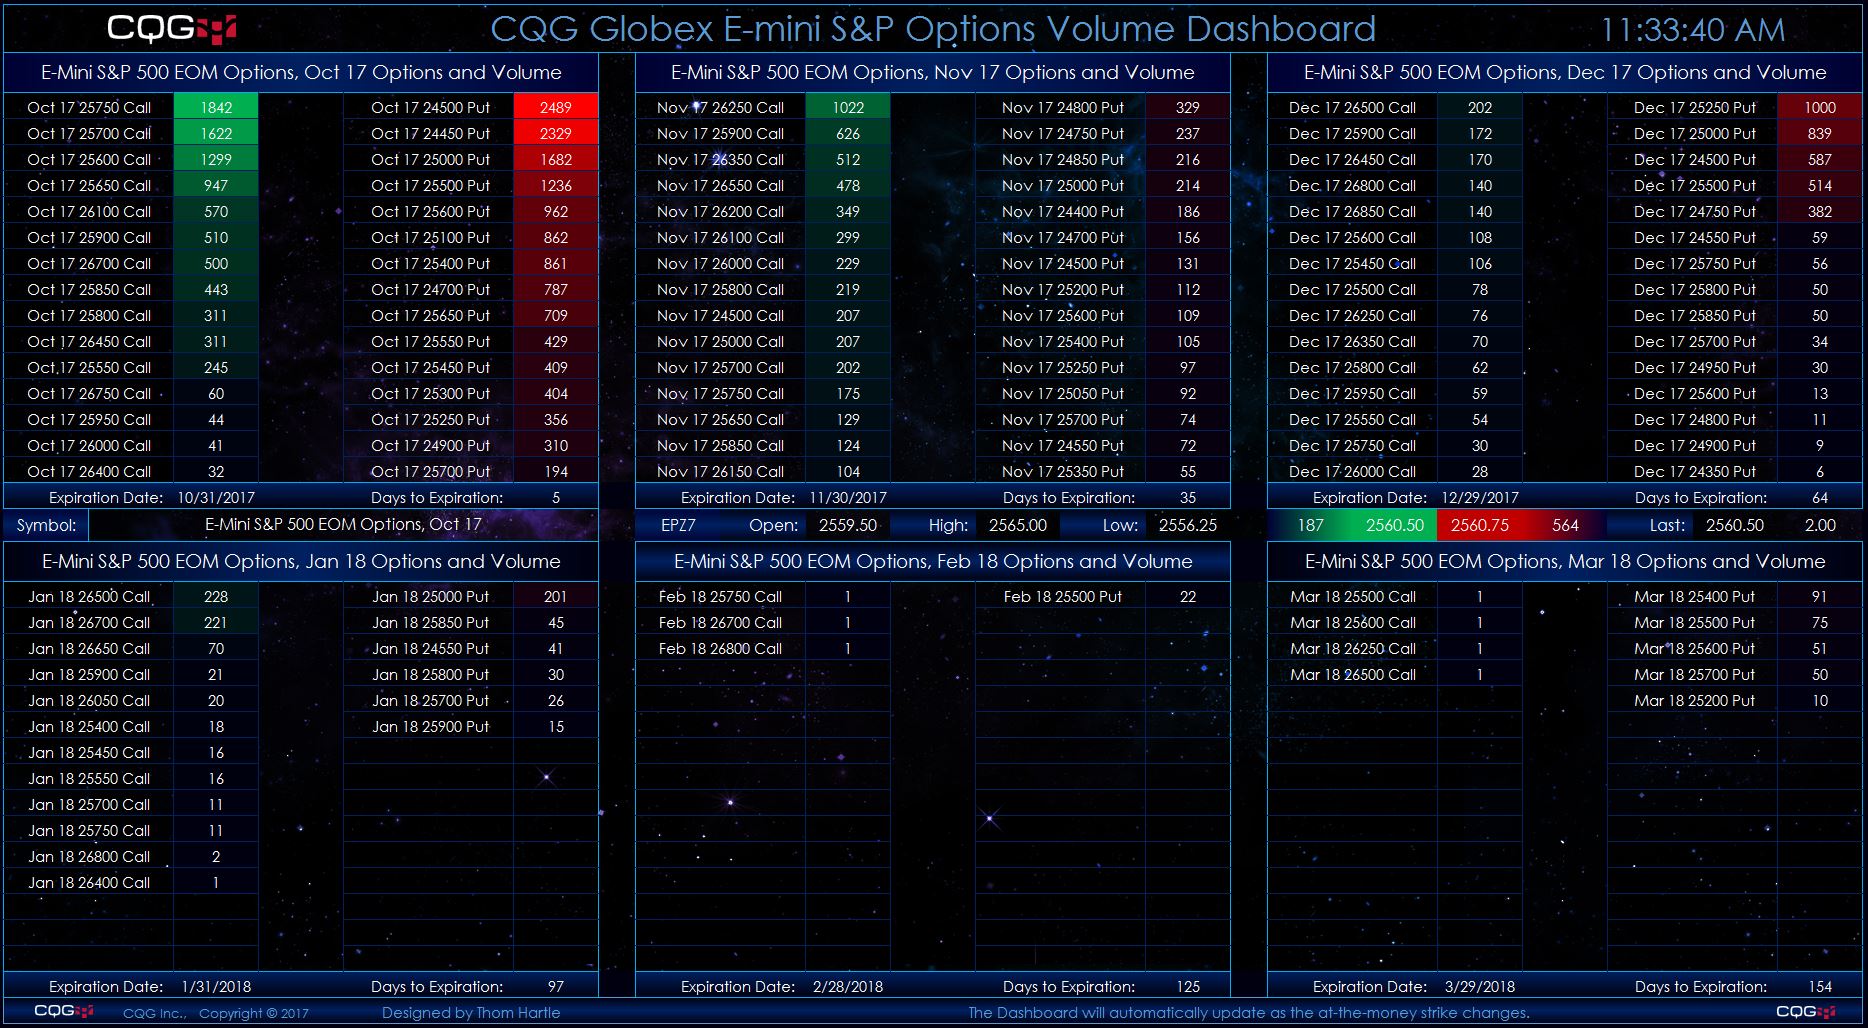
This Microsoft Excel® dashboard scans options on the E-mini S&P 500 futures market using the CQG RTD Toolkit for volume and displays strikes ranked by the volume traded for each listed expiry… more
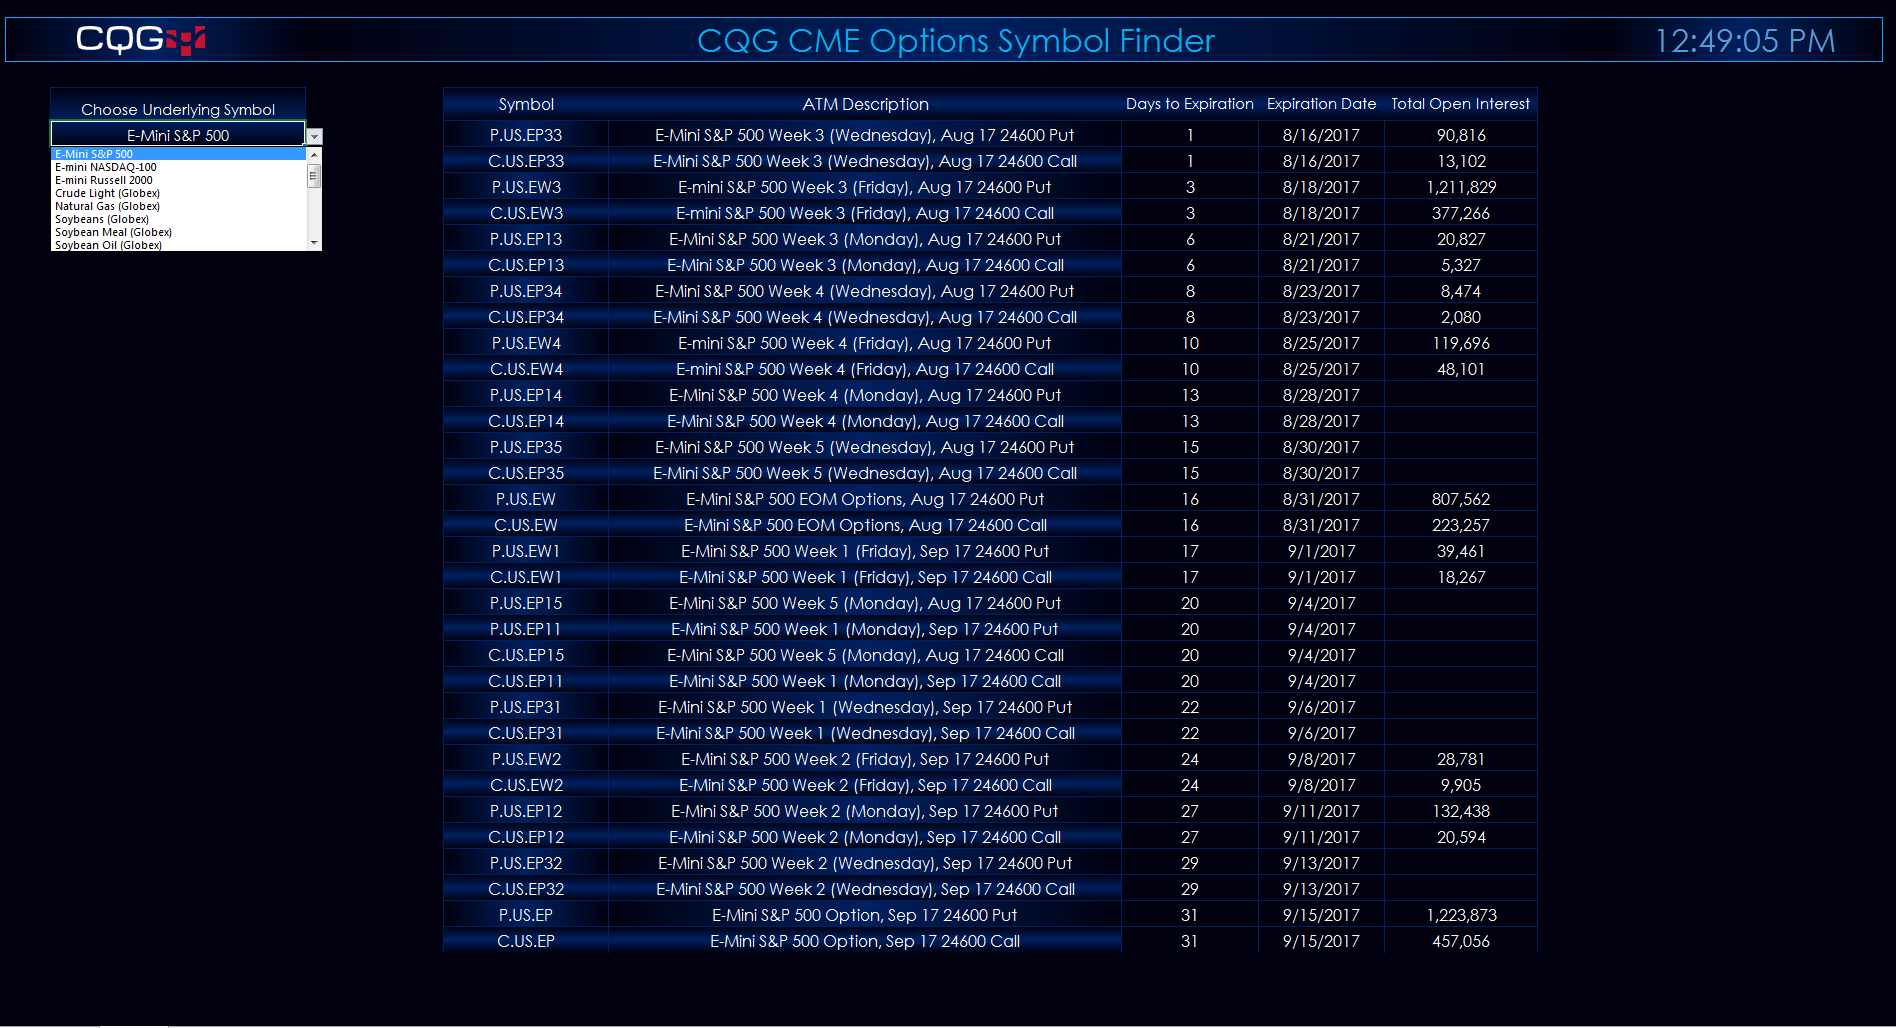
This Microsoft Excel® dashboard provides a drop-down menu where you can select the underlying market, such as E-mini S&P 500. The display will then show all front contract option symbols… more
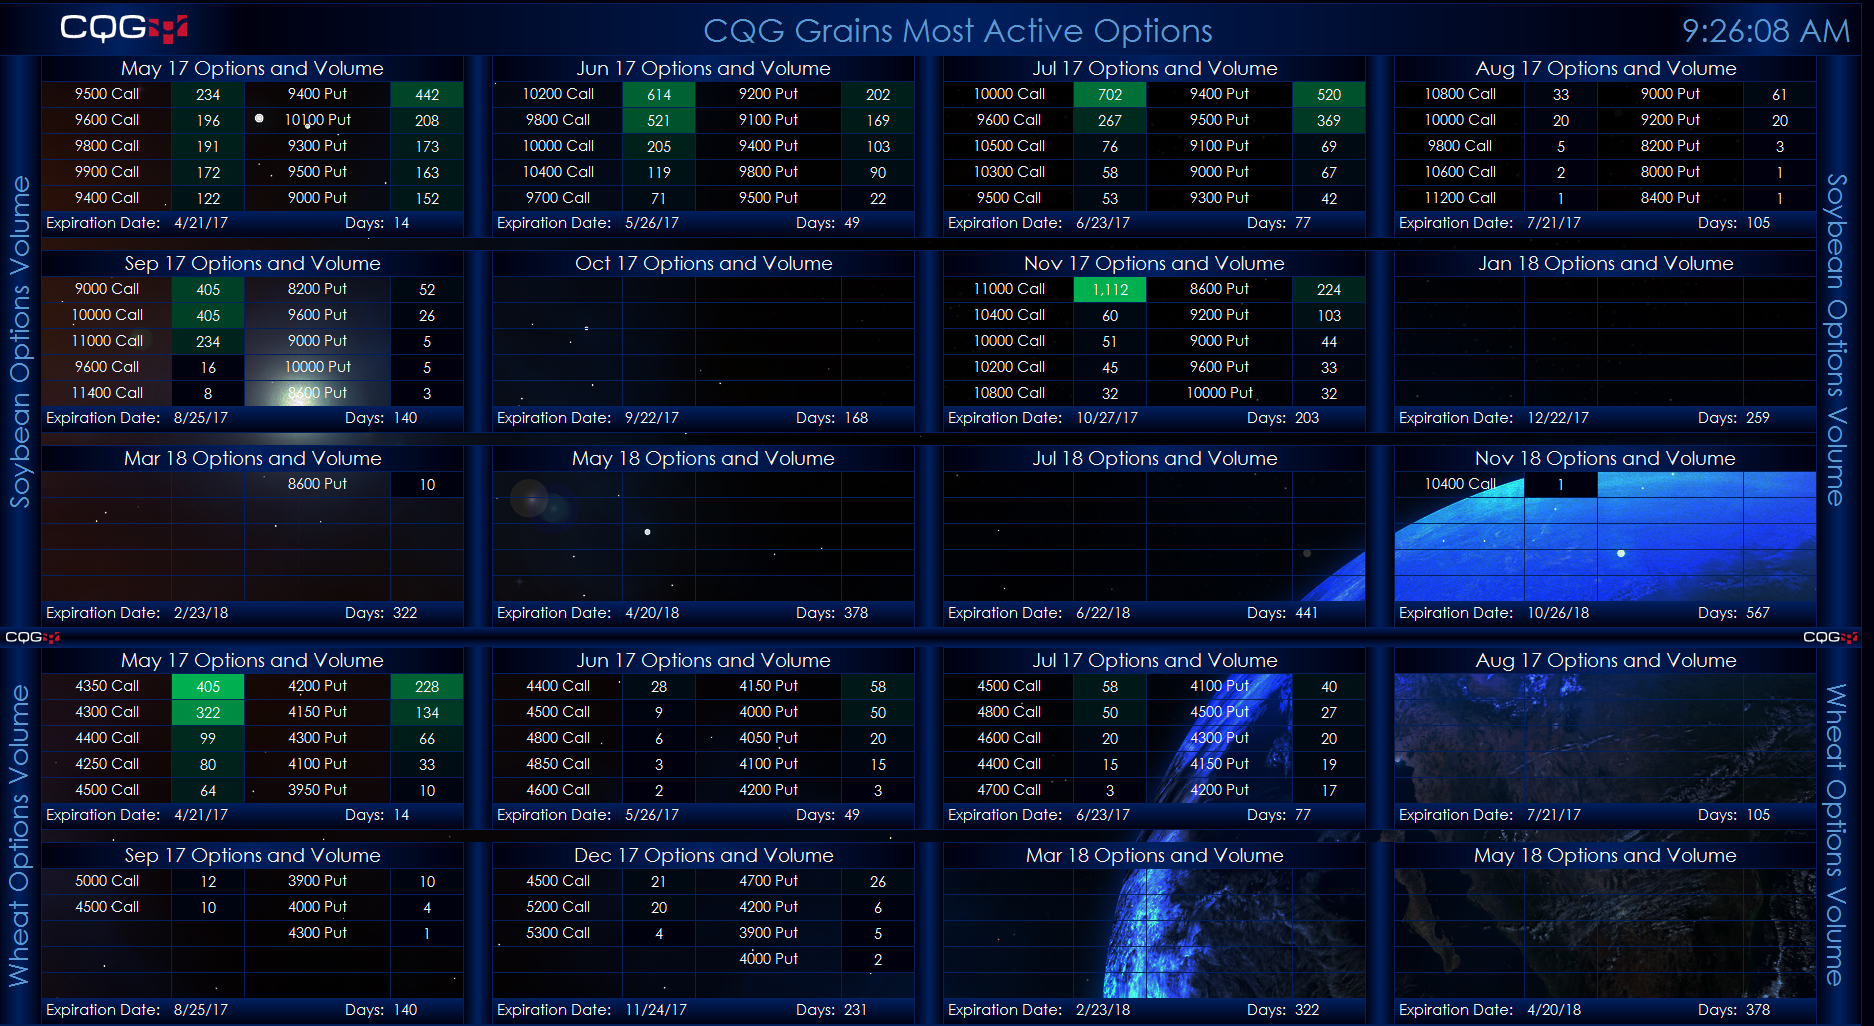
This Microsoft Excel® dashboard scans the options on soybeans, wheat, and corn (Globex) futures markets for volume. It displays strikes ranked by the volume traded for each expiry listed… more

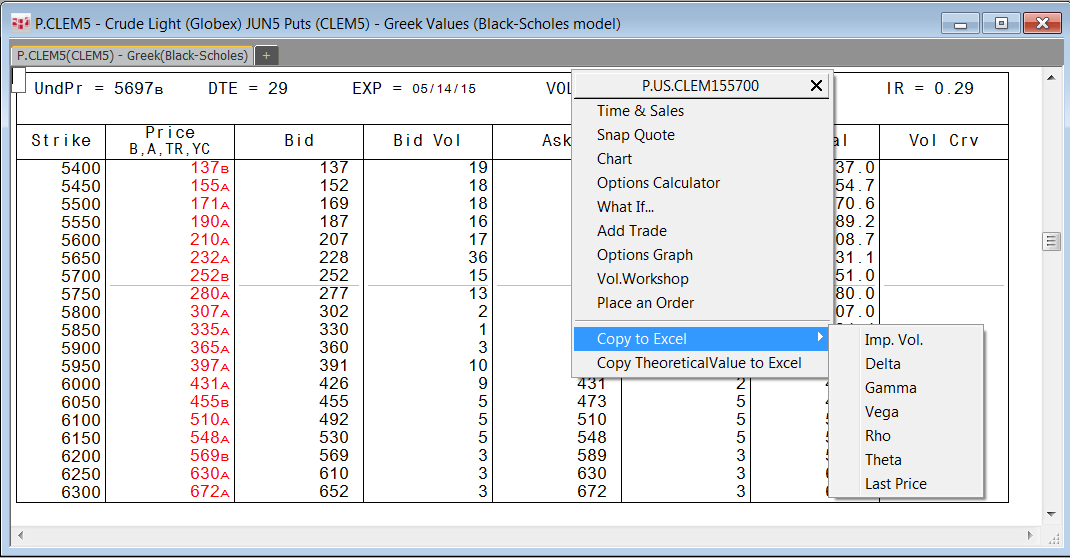
This Microsoft Excel® dashboard uses the CQG RTD OptVal formula to calculate implied volatility, theoretical value, delta, and the Greeks using data inputs from other RTD formulas.
… more
You can use Microsoft Excel® and data from CQG to expand the features of your own market display dashboards. This powerful combination can be tailored to your specific needs. This article shows… more

Options offer a wide variety of strategies for traders. CQG provides a powerful options analytics package. A number of the analytics tools, such as theoretical value, implied volatility, and the… more