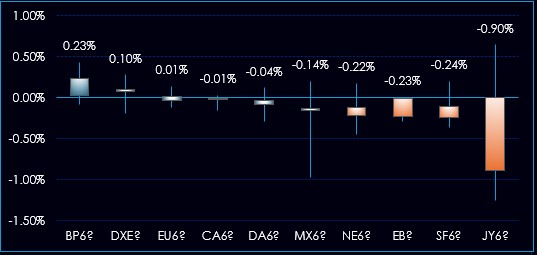
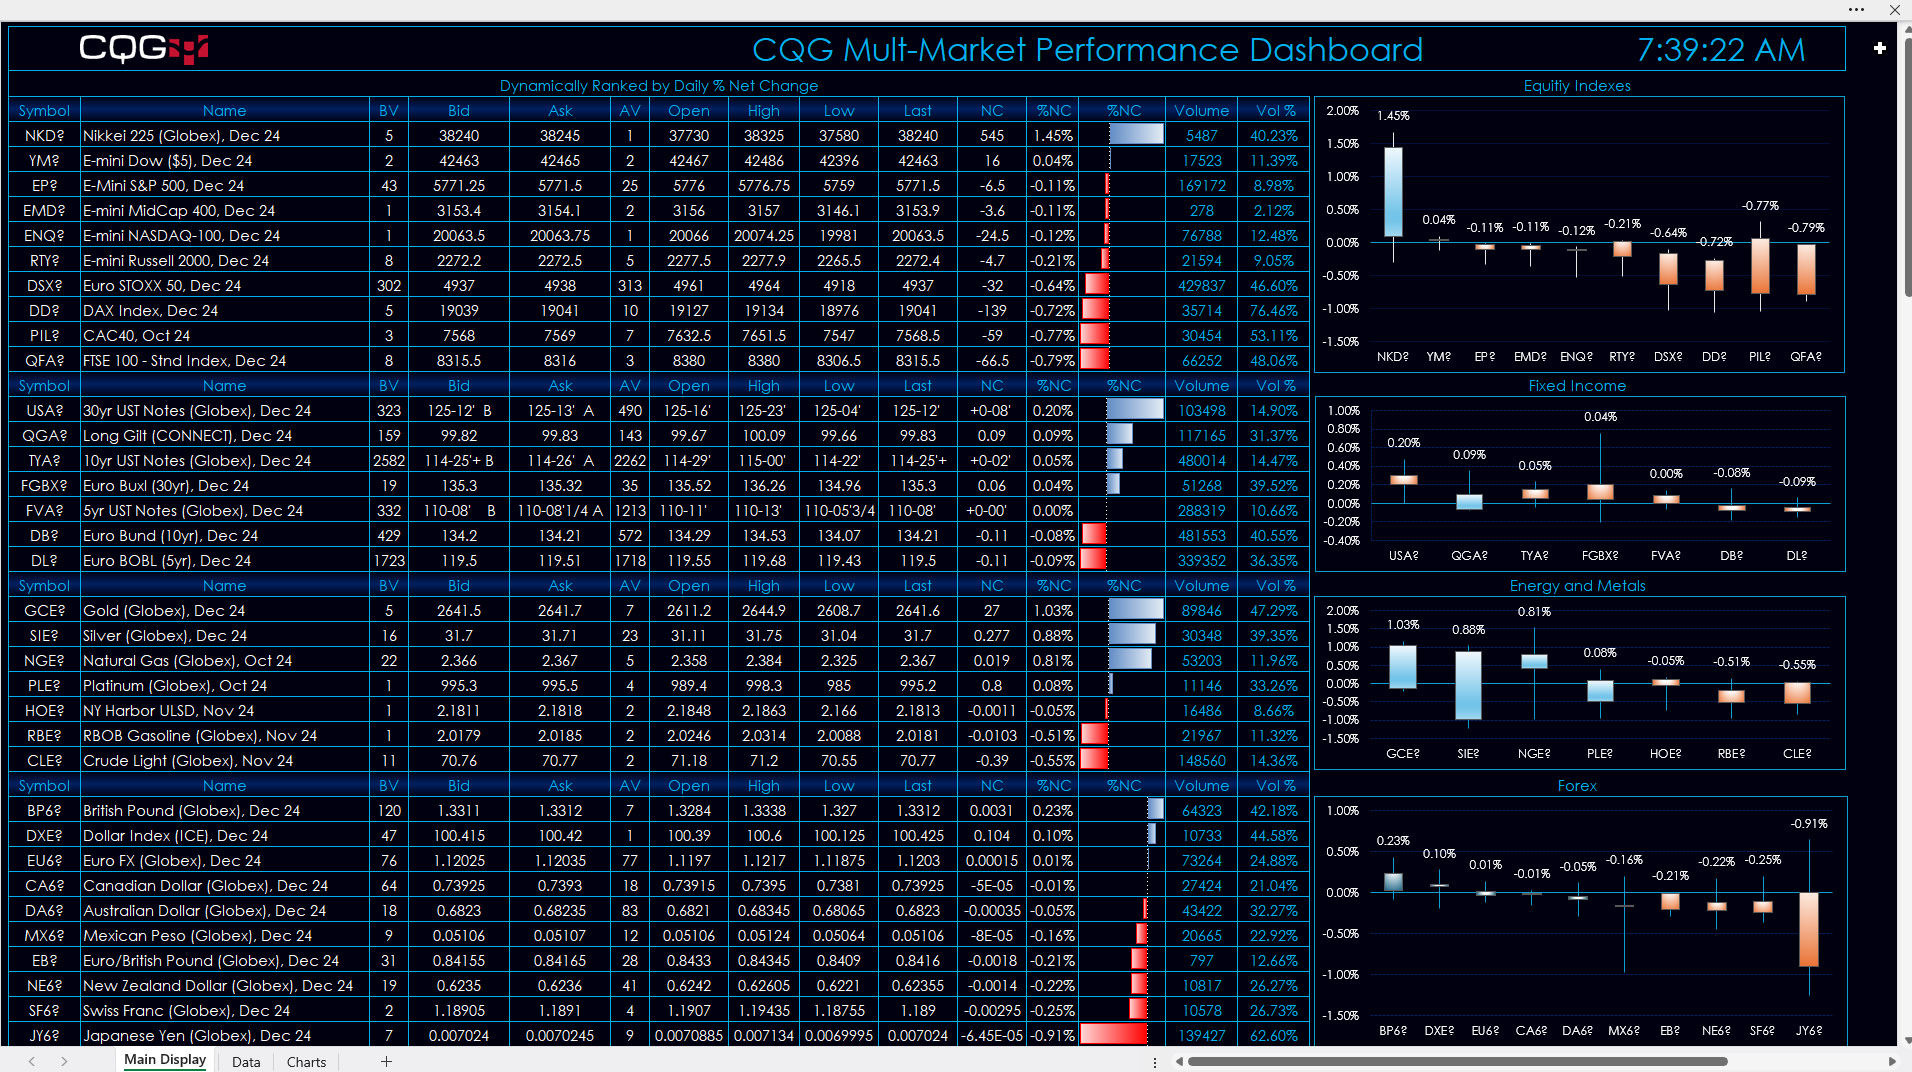
This Excel 365 Dashboard tracks the daily individual performance of multi-market groups: Equity Indexes, Fixed Income, Metals and Energy, and Forex.
The groups are dynamically ranked from top to bottom based on the net percentage change using the Excel SORT function.
The dashboard displays the following data:
- Symbol
- Description
- Best bid volume
- Best bid
- Best ask
- Best ask volume
- Open
- High
- Low
- Last
- Net Change
- Percentage net change
- Today's volume
- The ratio of today's volume compared to the 21-day MA of the volume.
In addition, a candlestick chart for each group is displayed.
Here is the full dashboard.
Requirements: CQG Integrated Client or QTrader, and Excel 365 (locally installed, not in the Cloud) or more recent.


