Tracking and analyzing cash market data is more difficult because most cash market data is a single print for the day of the report, that is there is no open, high, low or close, just the close.… more
Workspaces
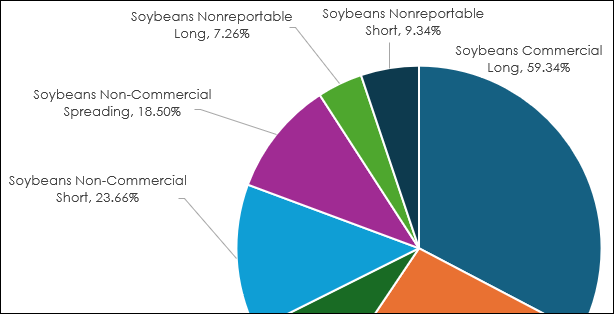
Pie charts are a popular visual presentation used by analysts for detailing a percentage of a whole, with a circle representing the whole and slices representing the categories that make up the… more