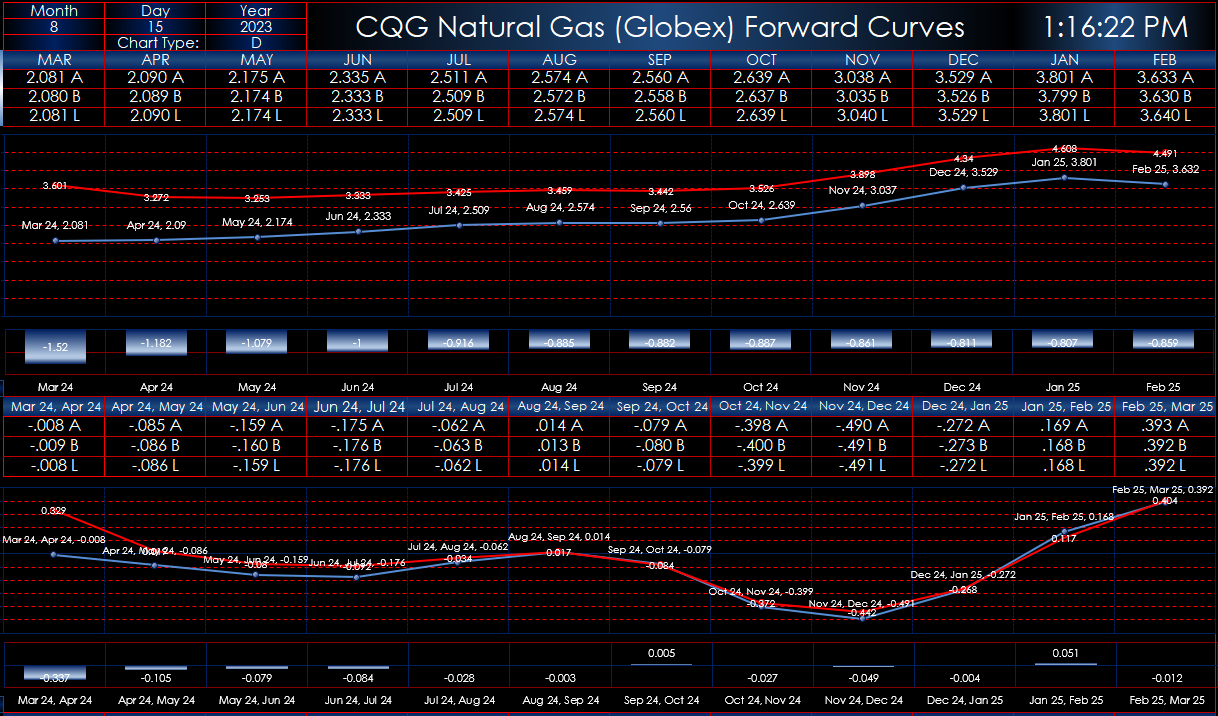
This Microsoft® Excel dashboard uses RTD formulas based on a user input symbol (please use all capital letters) to display a forward curve of the outrights and forward curves for six calendar… more
Workspaces
This Microsoft Excel® dashboard has three tabs. The first tab displays today’s market quotes, volume, and open interest data. If the last price is matching the open price, then the open price… more
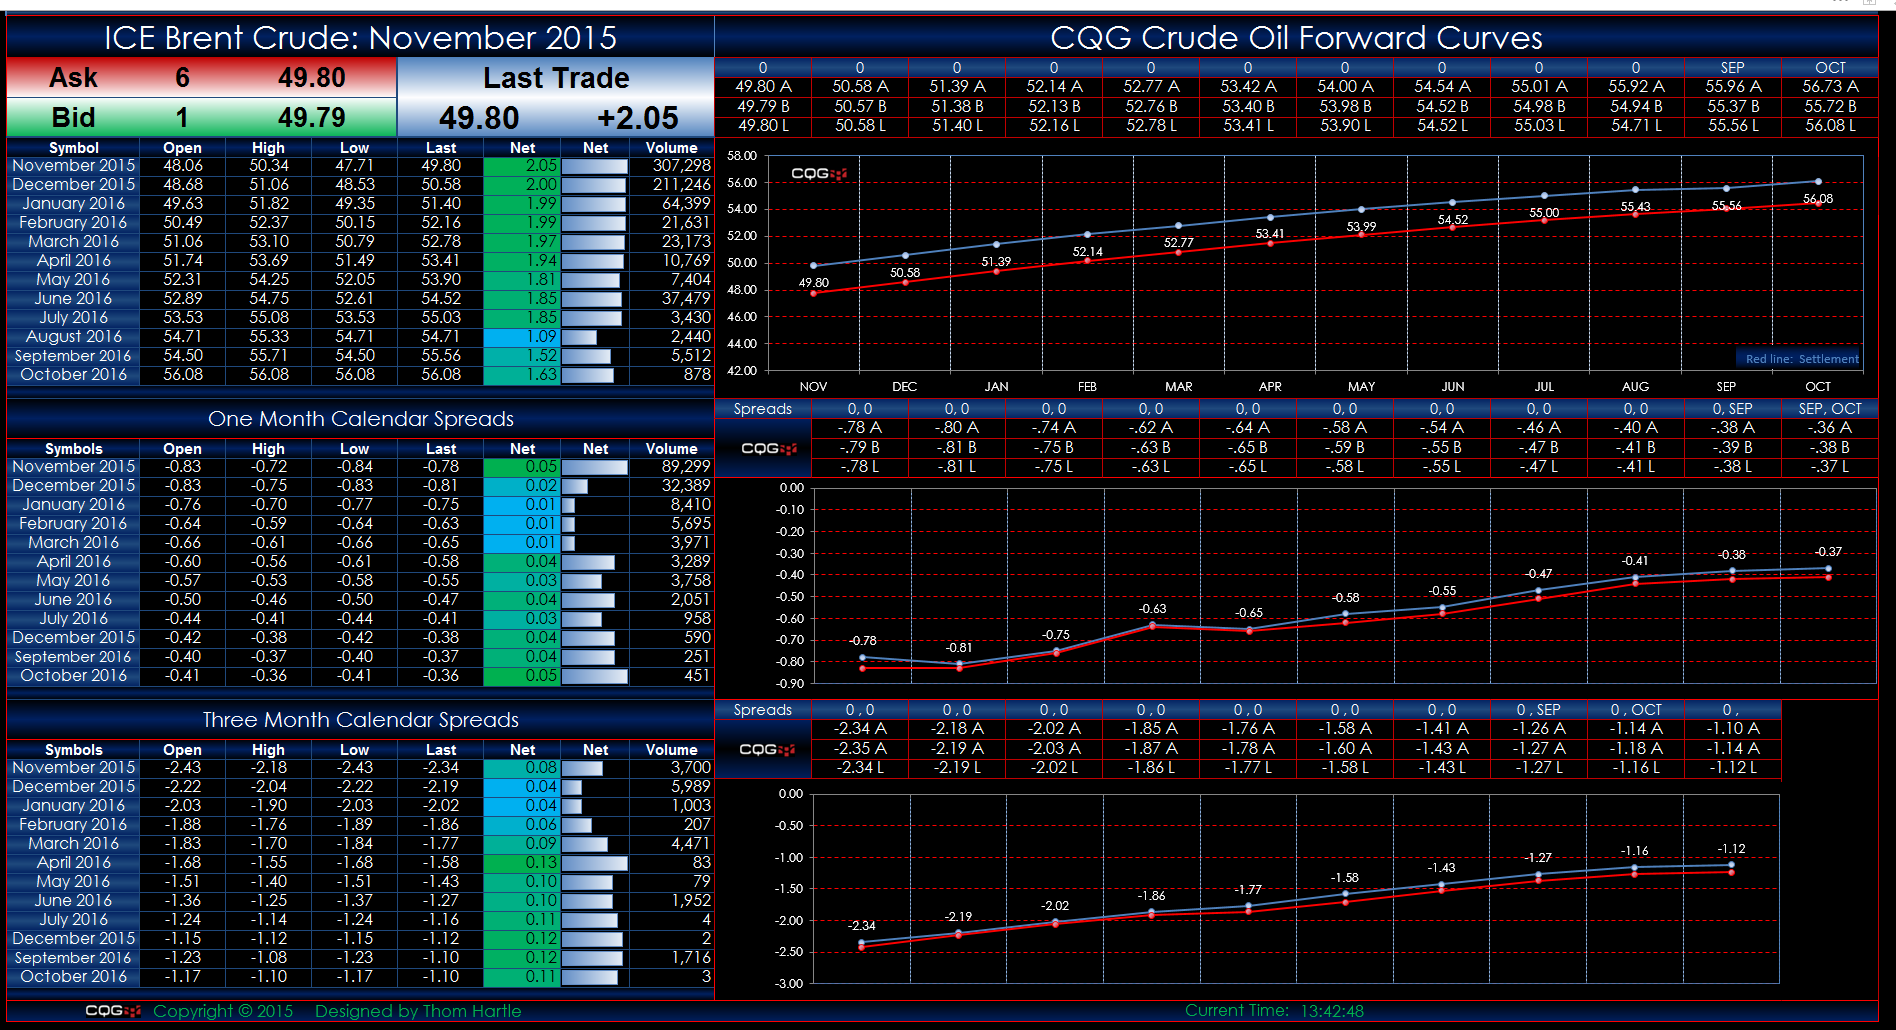
This Microsoft Excel® spreadsheet uses the CQG Toolkit to pull in Brent Crude Oil market data traded on the ICE exchange.
The forward curves display today's data. If the last price is… more
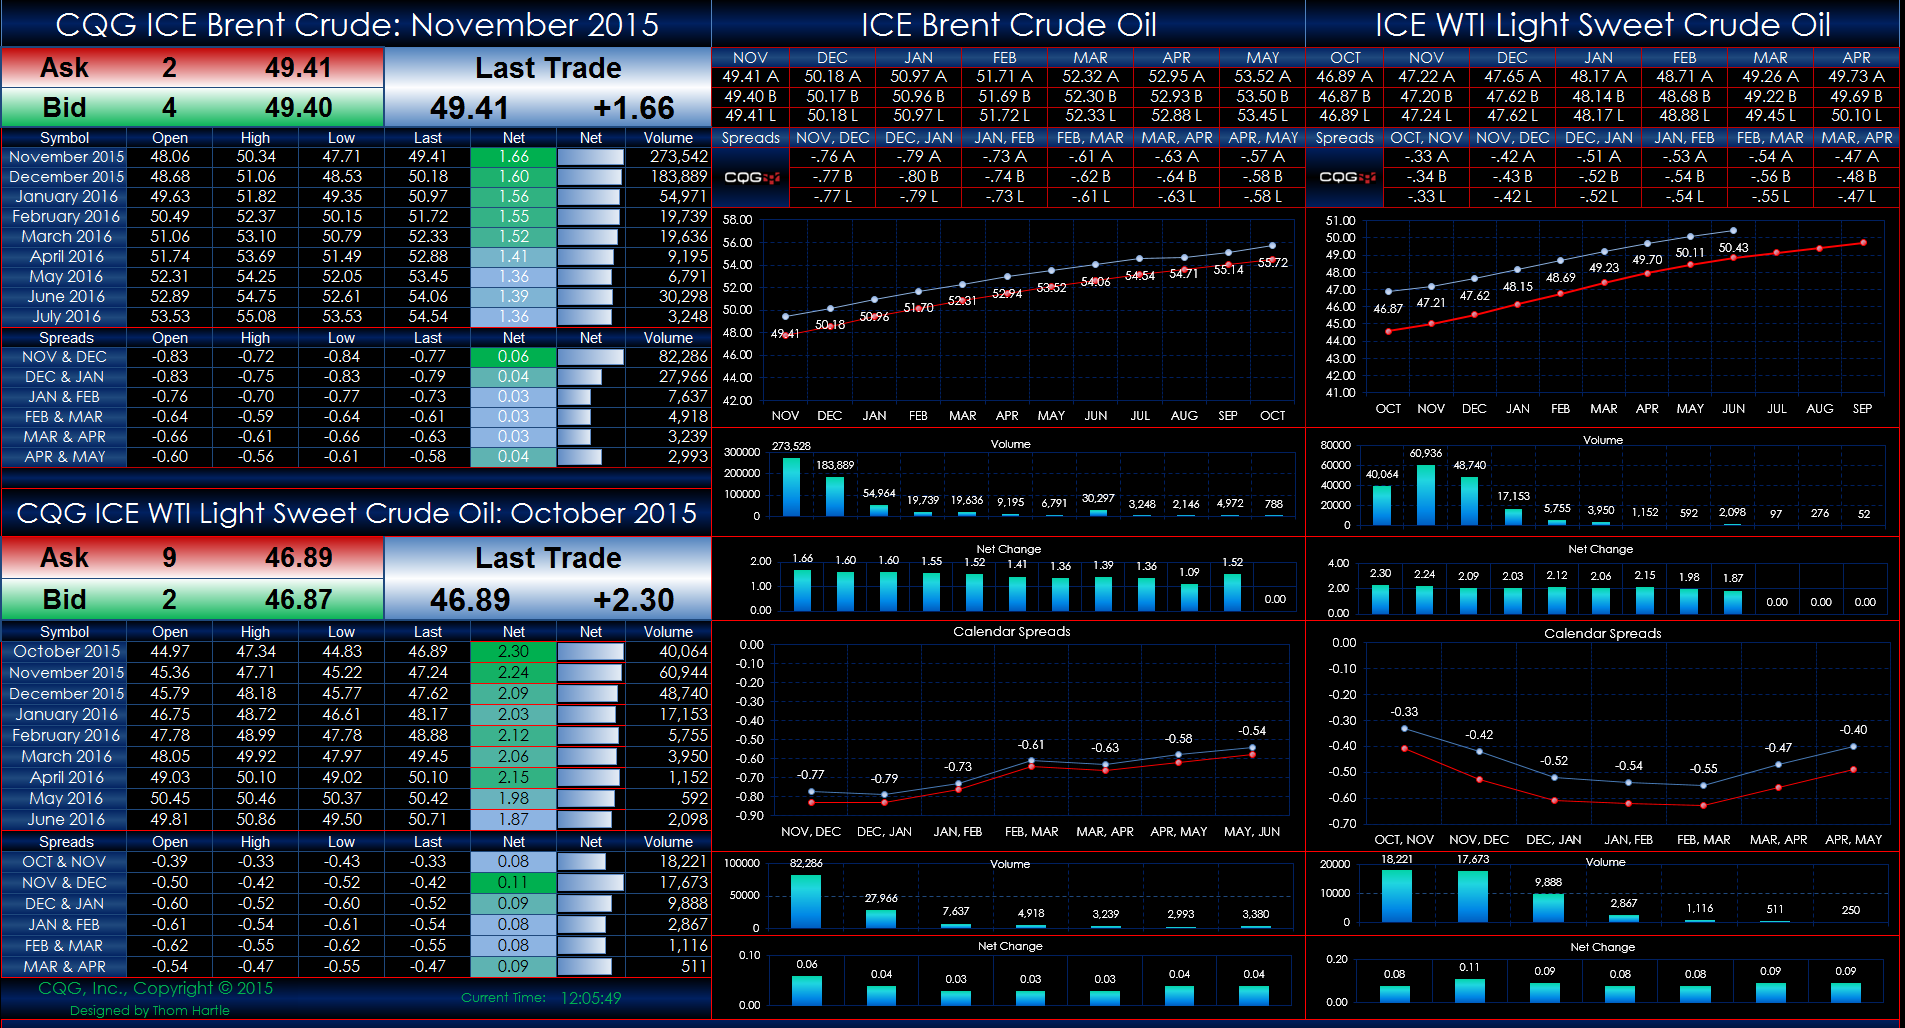
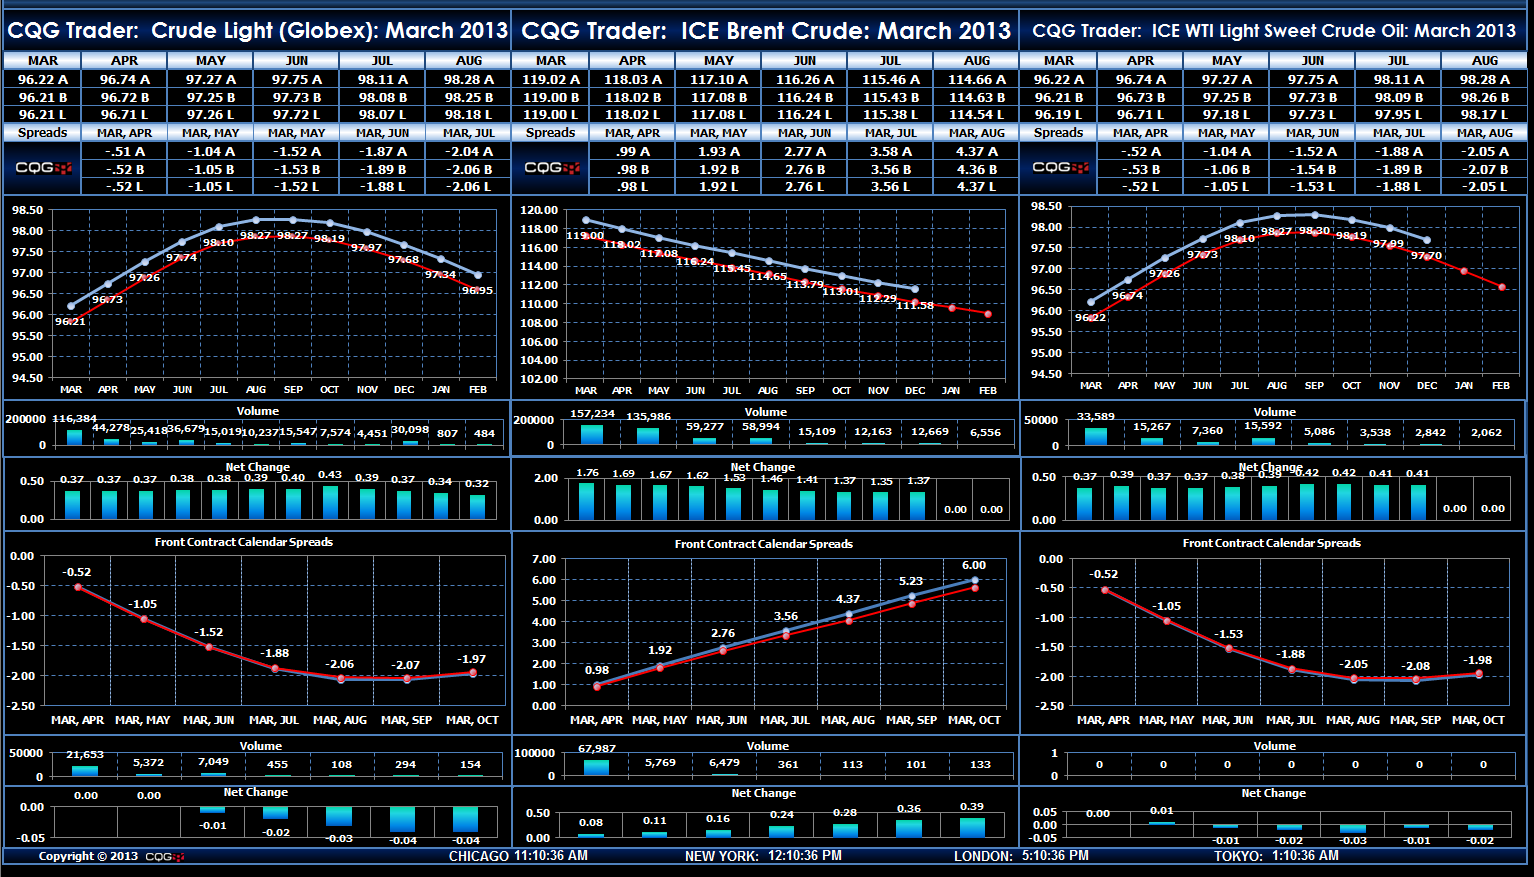
This Microsoft Excel® spreadsheet uses the CQG Toolkit to pull in Brent Crude Oil and WTI Light Sweet Crude Oil market data traded on the ICE exchange.
The forward curves display today's… more
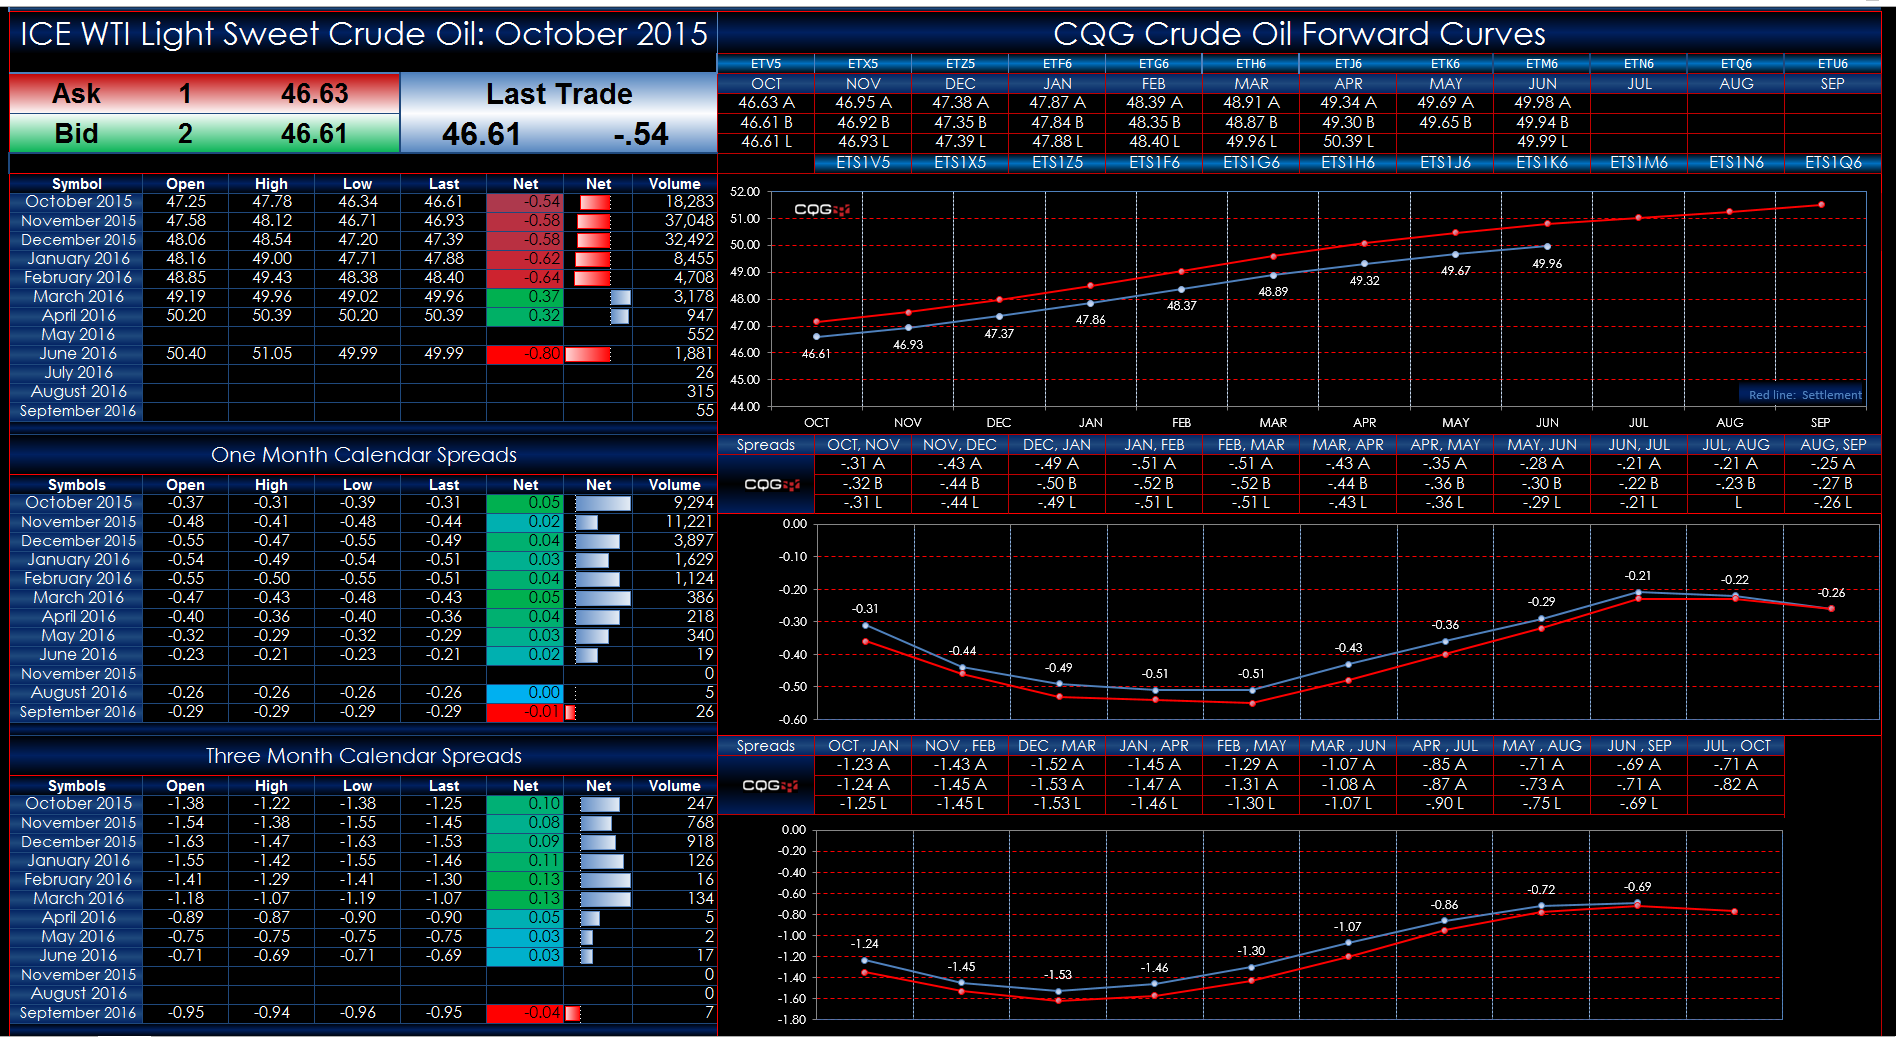
This Microsoft Excel® spreadsheet uses the CQG Toolkit to pull in WTI Light Sweet Crude Oil market data traded on the ICE exchange.
The dashboard uses a matrix-style presentation with the… more
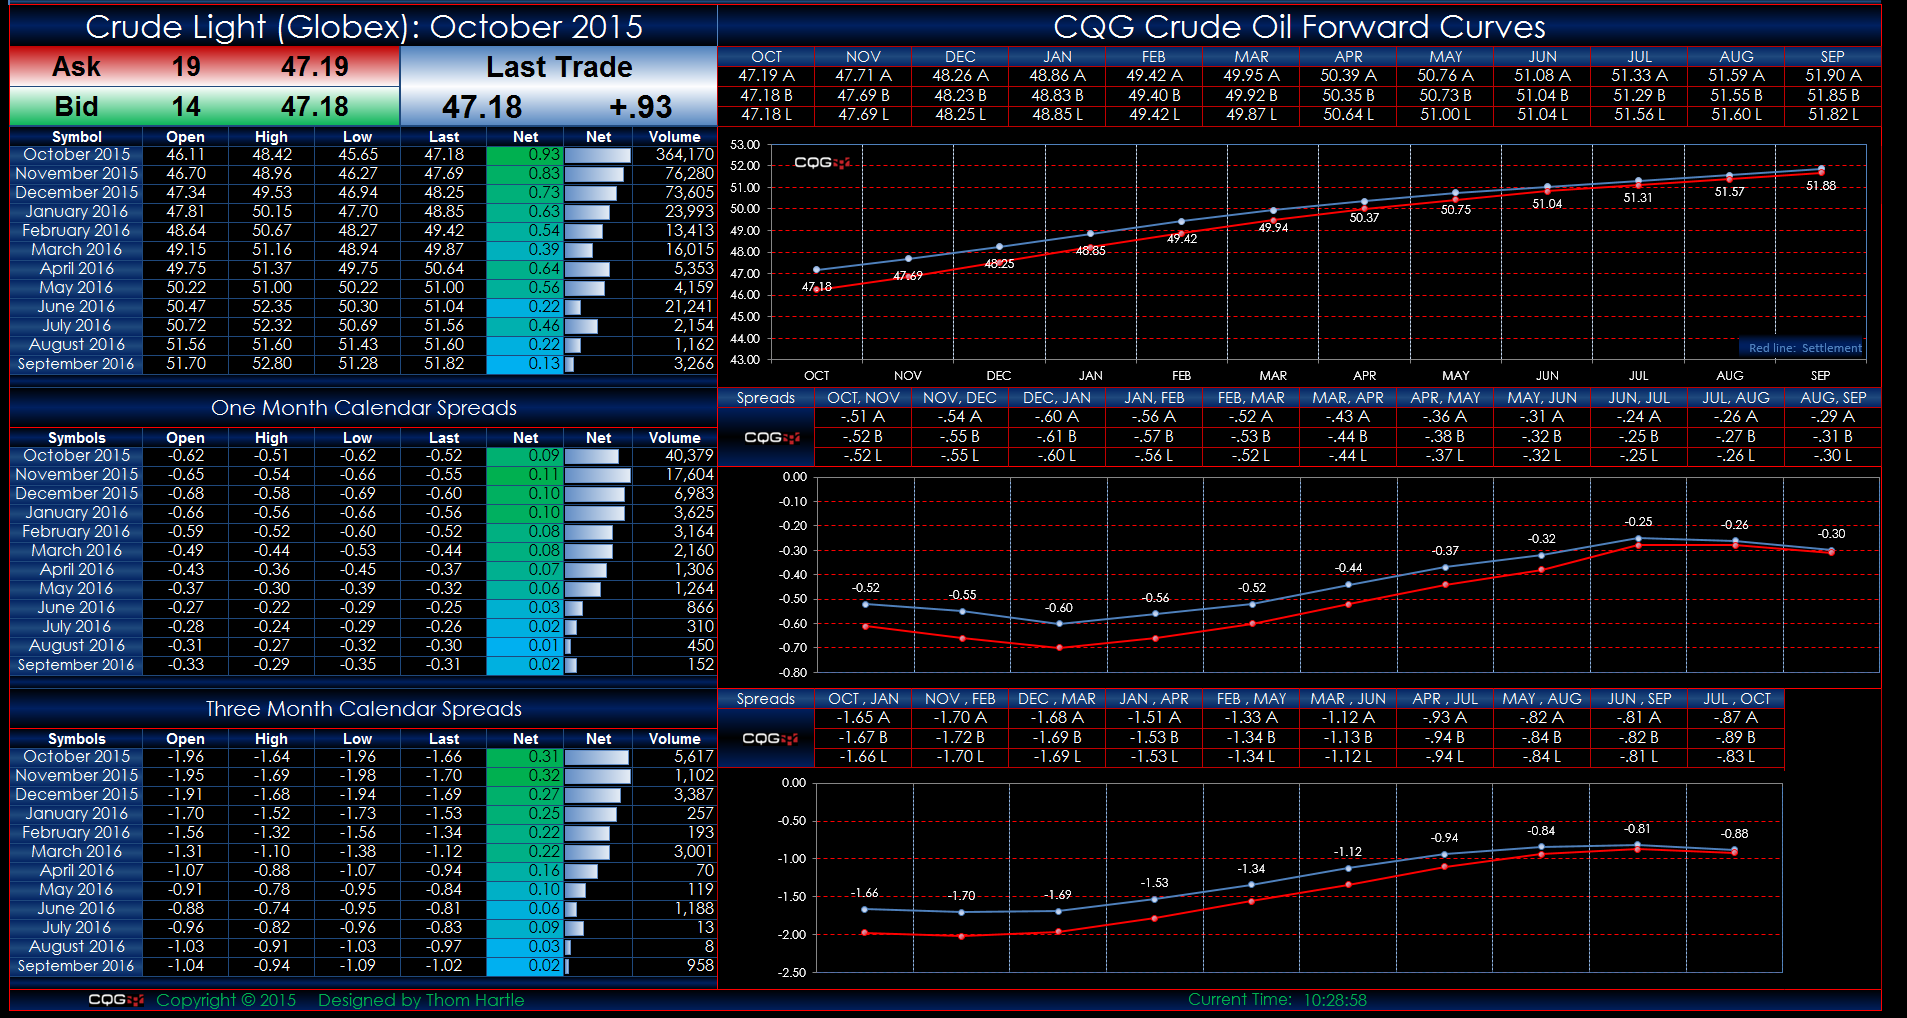
This Microsoft Excel® spreadsheet uses the CQG Toolkit to pull in market data for crude oil traded on CME Globex.
Twelve months of outrights, one-month, and three-month calendar spreads are… more
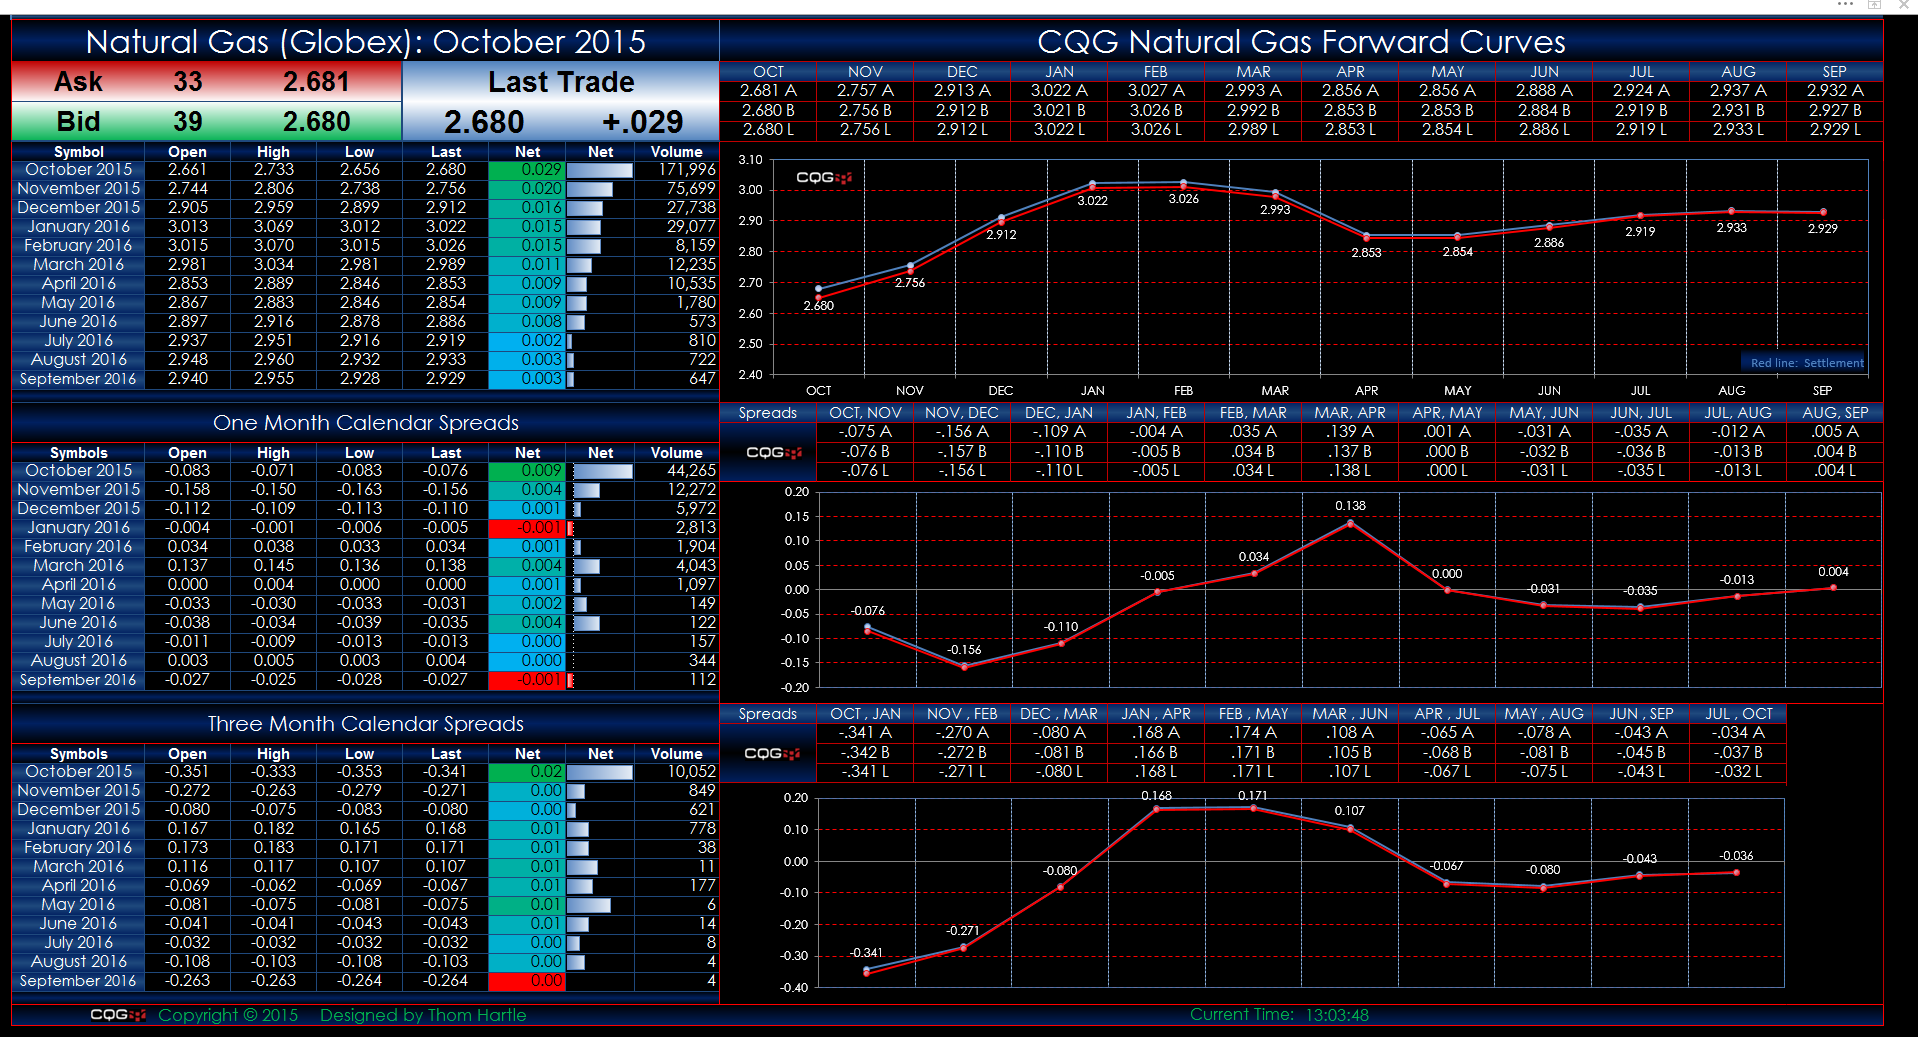
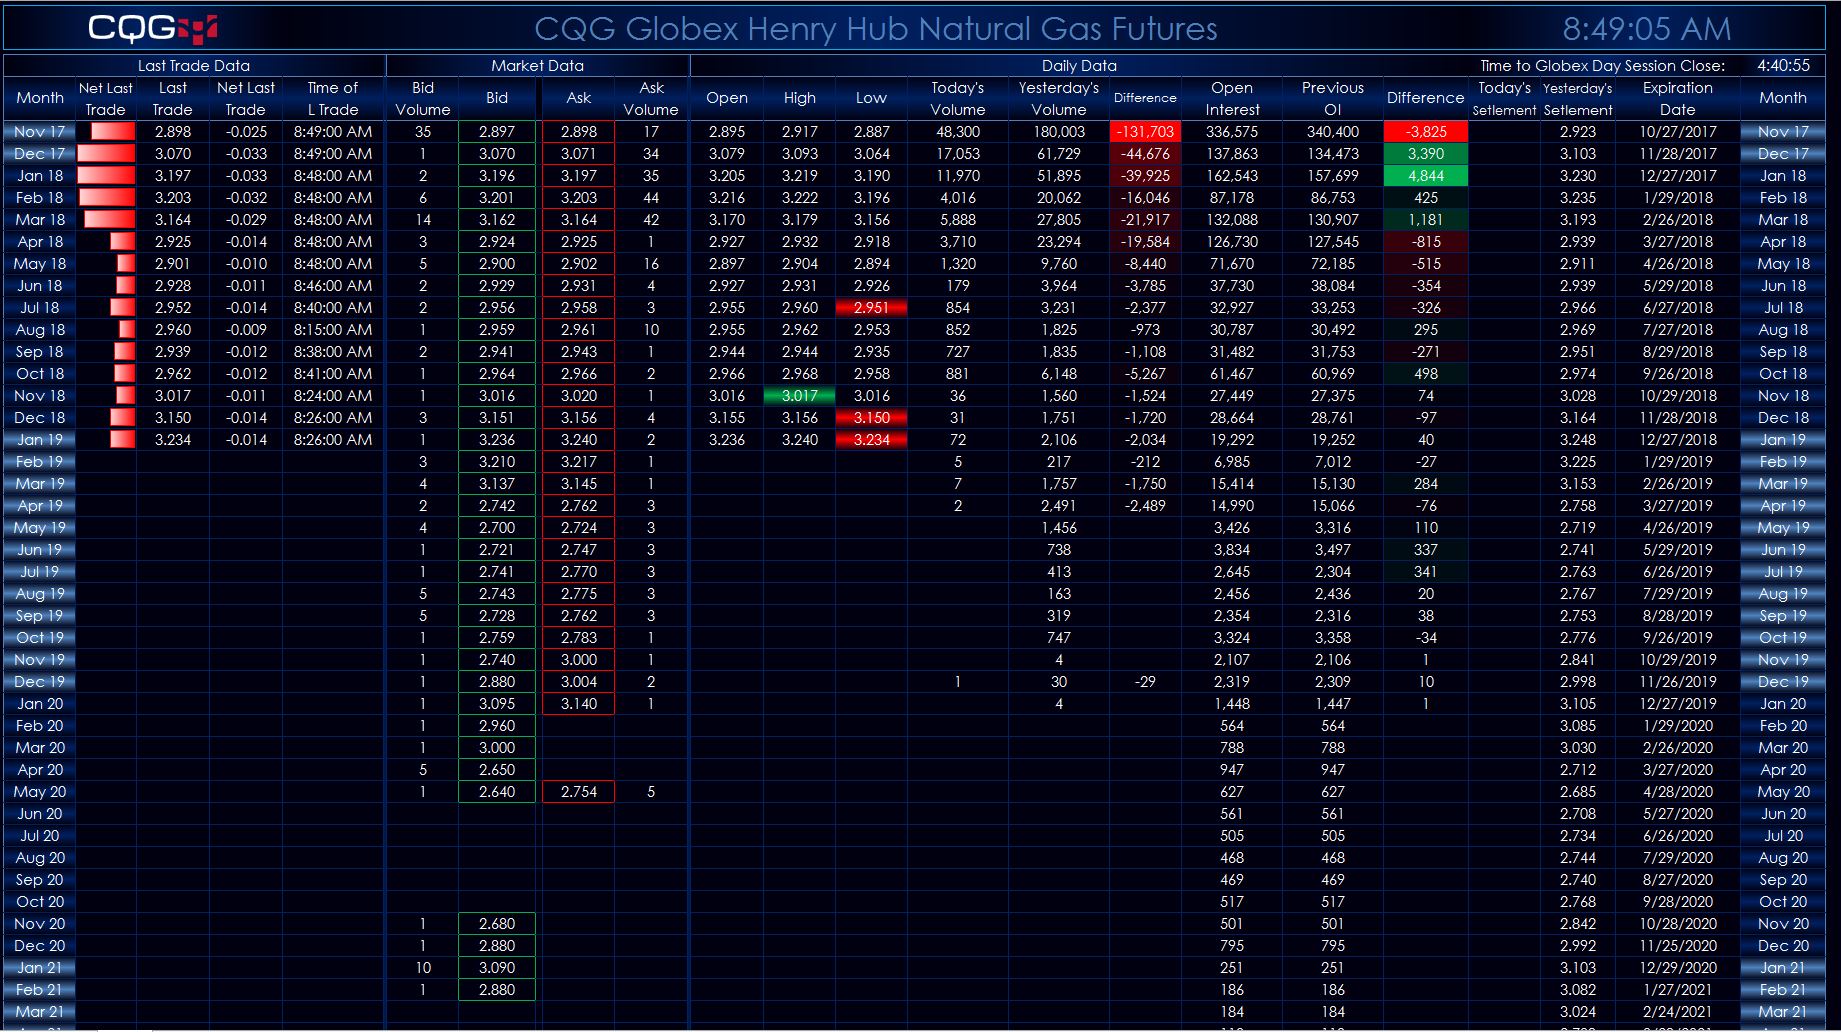
This Microsoft Excel® spreadsheet uses the CQG Toolkit to pull in market data for natural gas traded on CME Globex.
Twelve months of outrights, one-month, and three-month calendar spreads… more
To access the RTD feature in CQG Trader, please contact your FCM. (CQG Trader RTD only works with 32-bit Excel).
This spreadsheet displays the current market data, last price, best bid, and… more