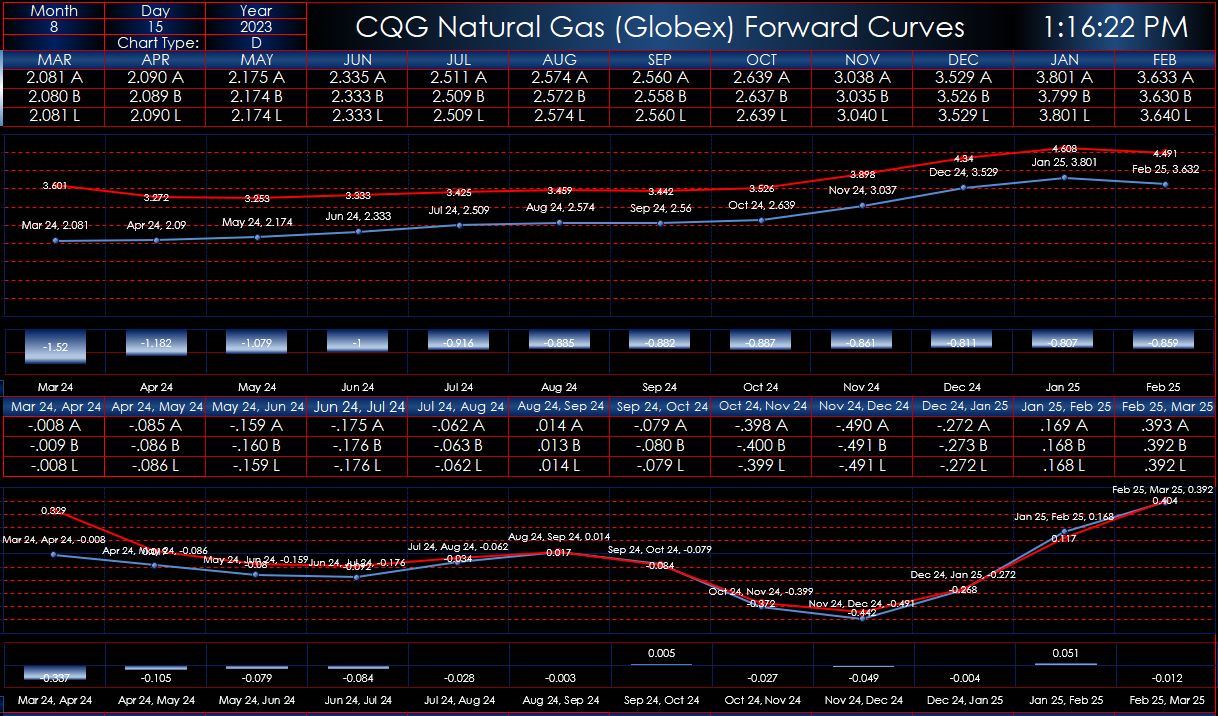
This Microsoft® Excel dashboard uses RTD formulas based on a user input symbol (please use all capital letters) to display a forward curve of the outrights and forward curves for six calendar spreads: One month to six months.
You enter the month, day, and year at the top of the dashboard for the historical forward curve. You can pull in historical closes as far back as 300 trading days. The historical forward curves use wildcard symbols and the standard rollover-at-expiration continuation setting. The closes are not equalized. The red lines on the forward curve charts are the historical closes. Each forward curve chart includes a net change histogram bar chart from today’s market prices versus the historical closes.
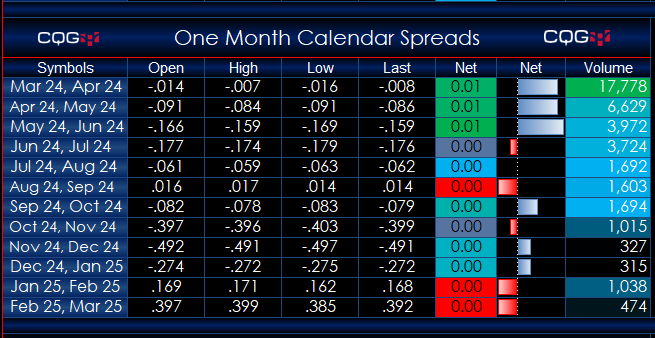
The quote displays the open, high, low, and last, as well as the volume. The net-change and volume columns are heat-mapped in the quote displays.
Today’s real-time forward curve uses the last trade for the data points unless the last trade is outside of the current best bid and ask. In that case, the midpoint of the best bid and best ask are displayed on the chart.
Requires CQG Integrated Client or CQG QTrader, data enablements for all symbols displayed in this spreadsheet, and Excel 2016 or more recent.