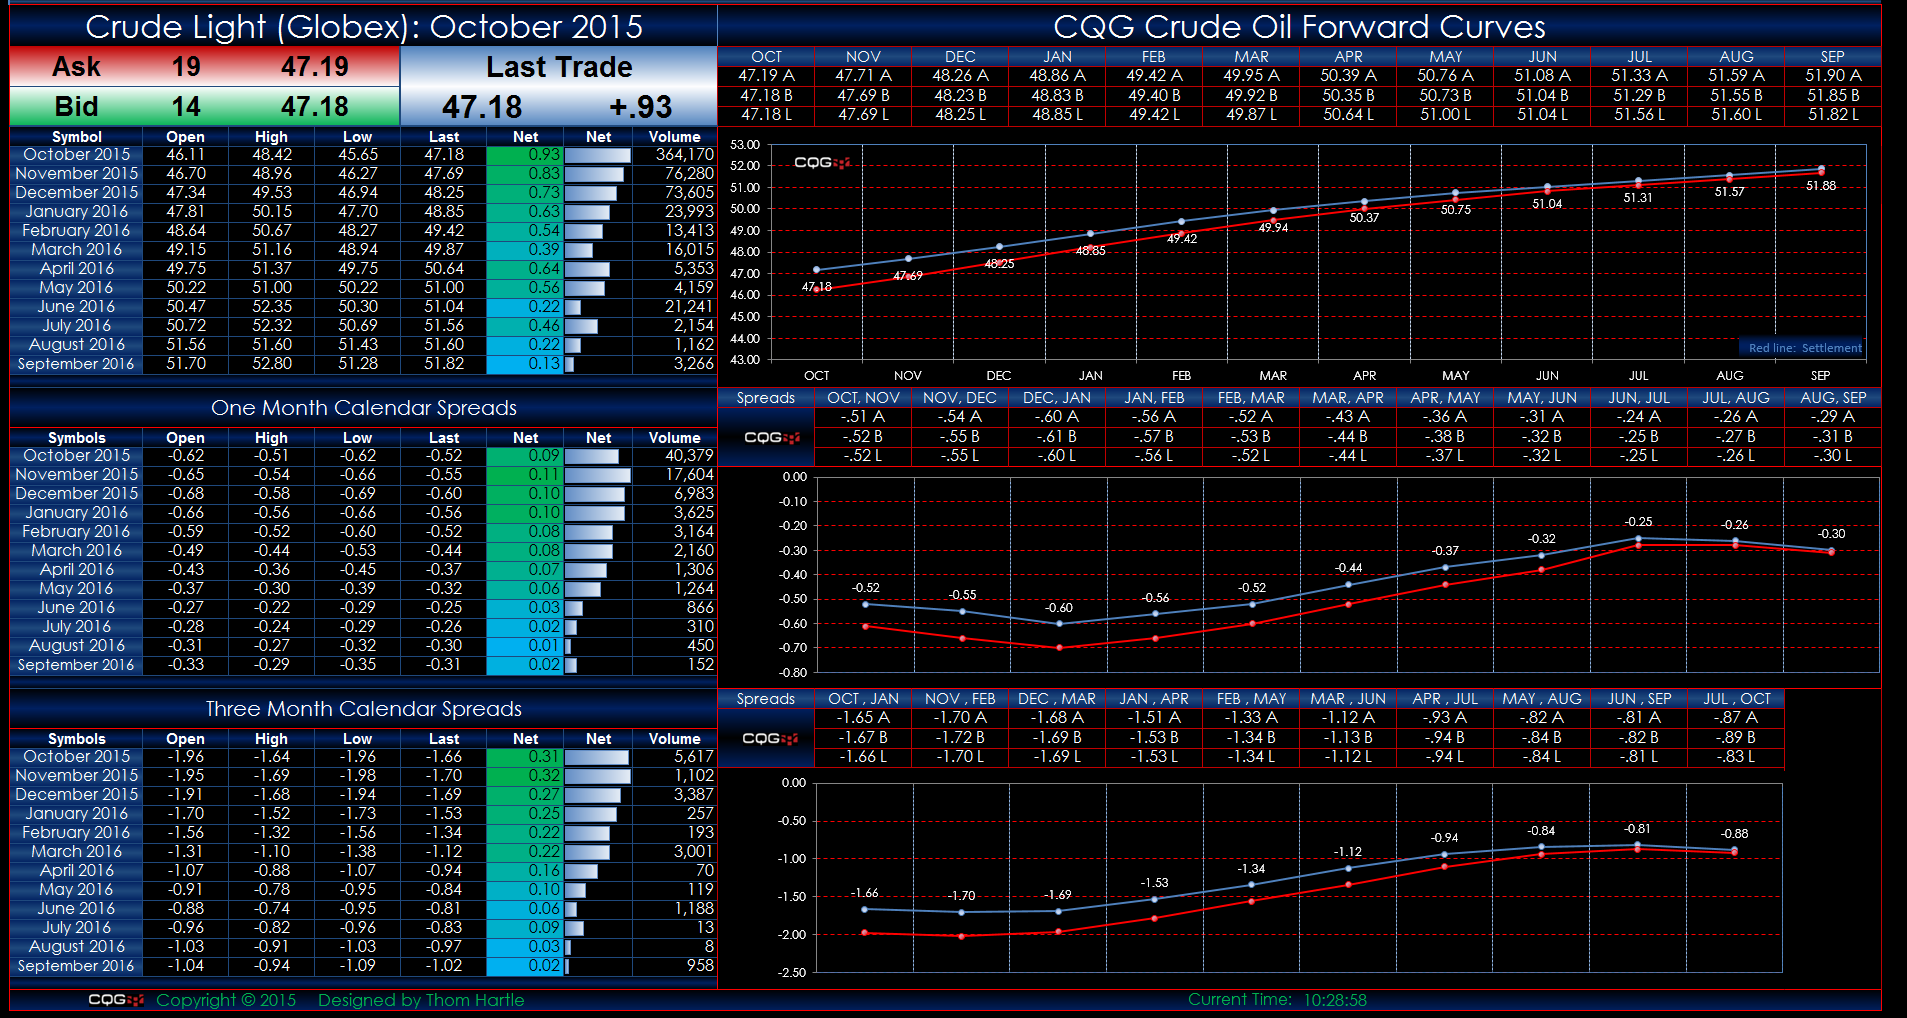
This Microsoft Excel® spreadsheet uses the CQG Toolkit to pull in market data for crude oil traded on CME Globex.
Twelve months of outrights, one-month, and three-month calendar spreads are displayed. The forward curves display today's data and the red line is the previous settlement. If the last price is outside of the best bid and best ask, then the mid-point between the best bid and best ask is used in the forward curve chart.
It is recommended that this Excel spreadsheet be closed each night to avoid Excel memory issues.
Make sure to lower your Excel RealTimeData (RTD) throttle to 50 milliseconds. Learn how to do that here.
Requires an enablement turned on by your FCM and Excel 2013 or more recent. This product is copyrighted content owned by CQG.