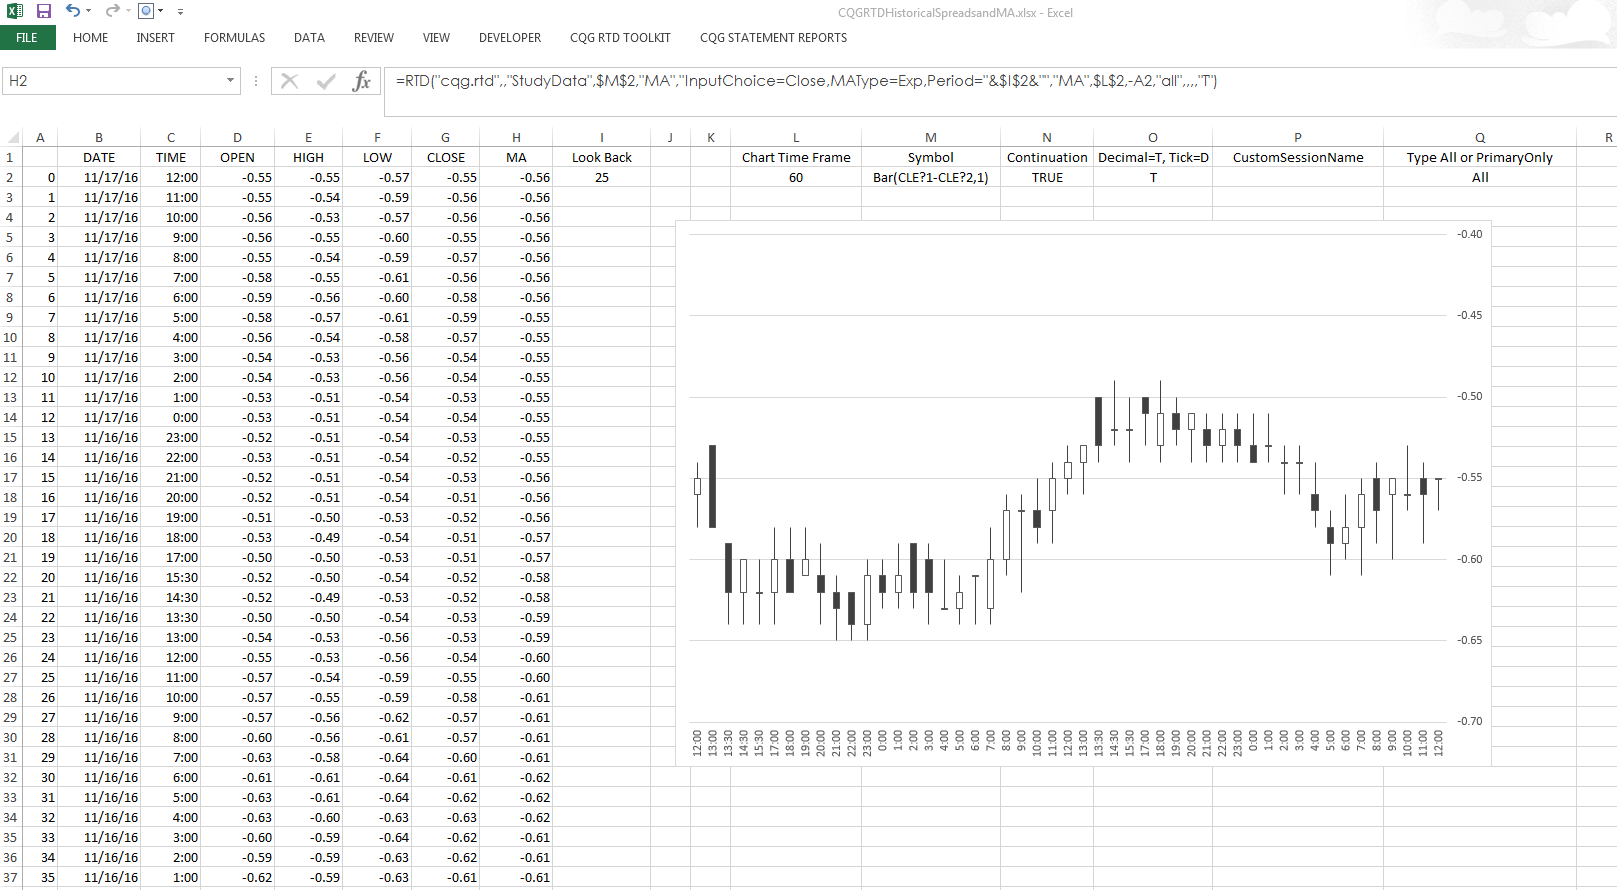
Pull historical spread data into Microsoft Excel® using RTD formulas with this sample spreadsheet. It not only pulls open, high, low, and close values into Excel, but also a study, the… more
Workspaces

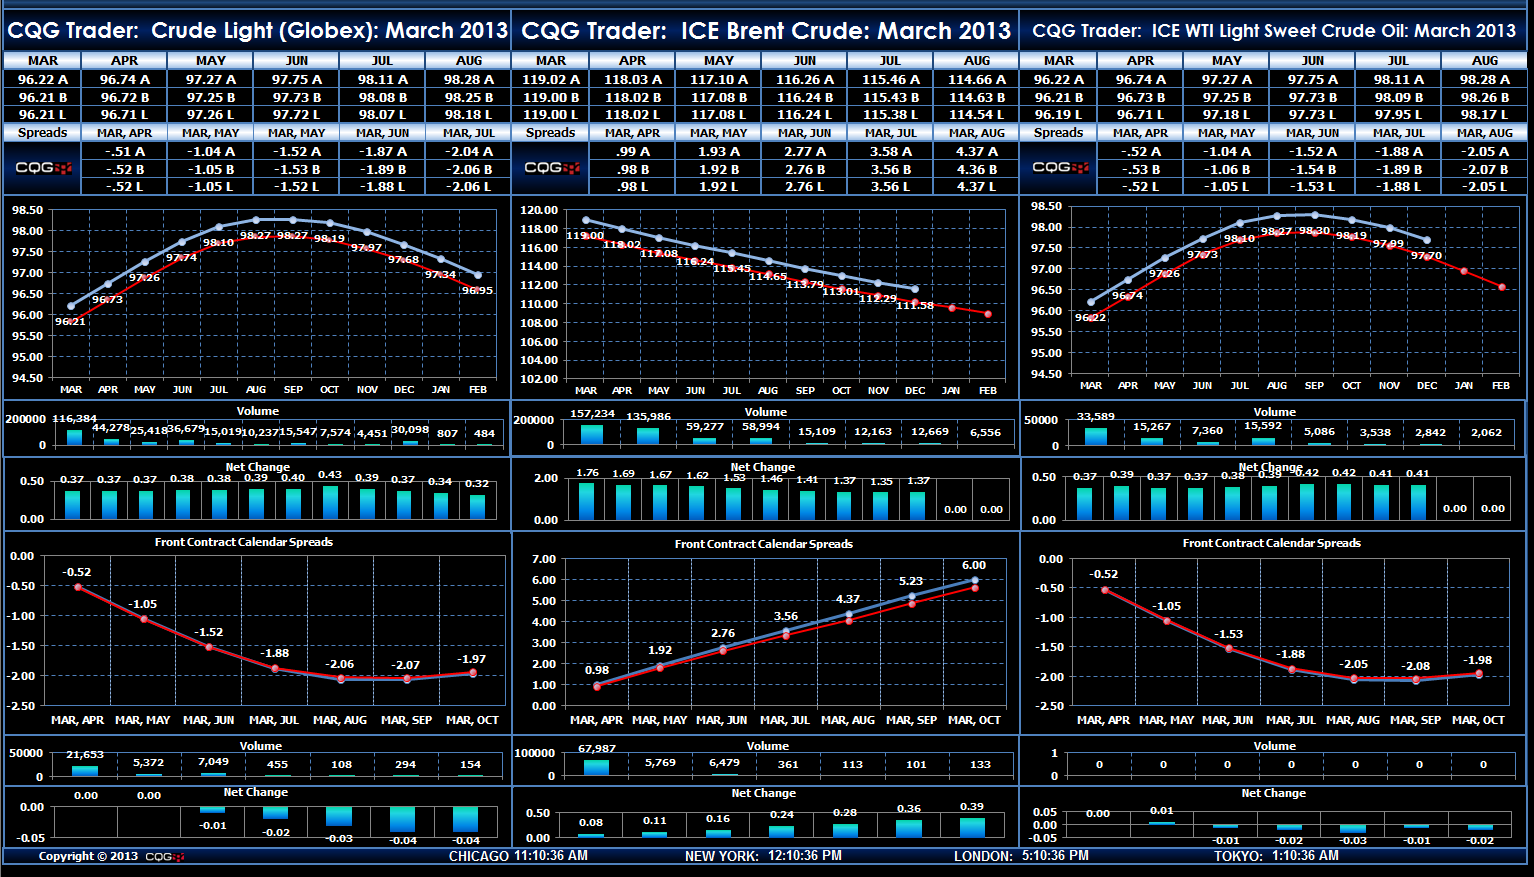
This Microsoft Excel® dashboard offers four charts displaying seventy-five open, high, low, and close bars of a spread. The spread symbols are entered into Excel on the symbols tab and the … more
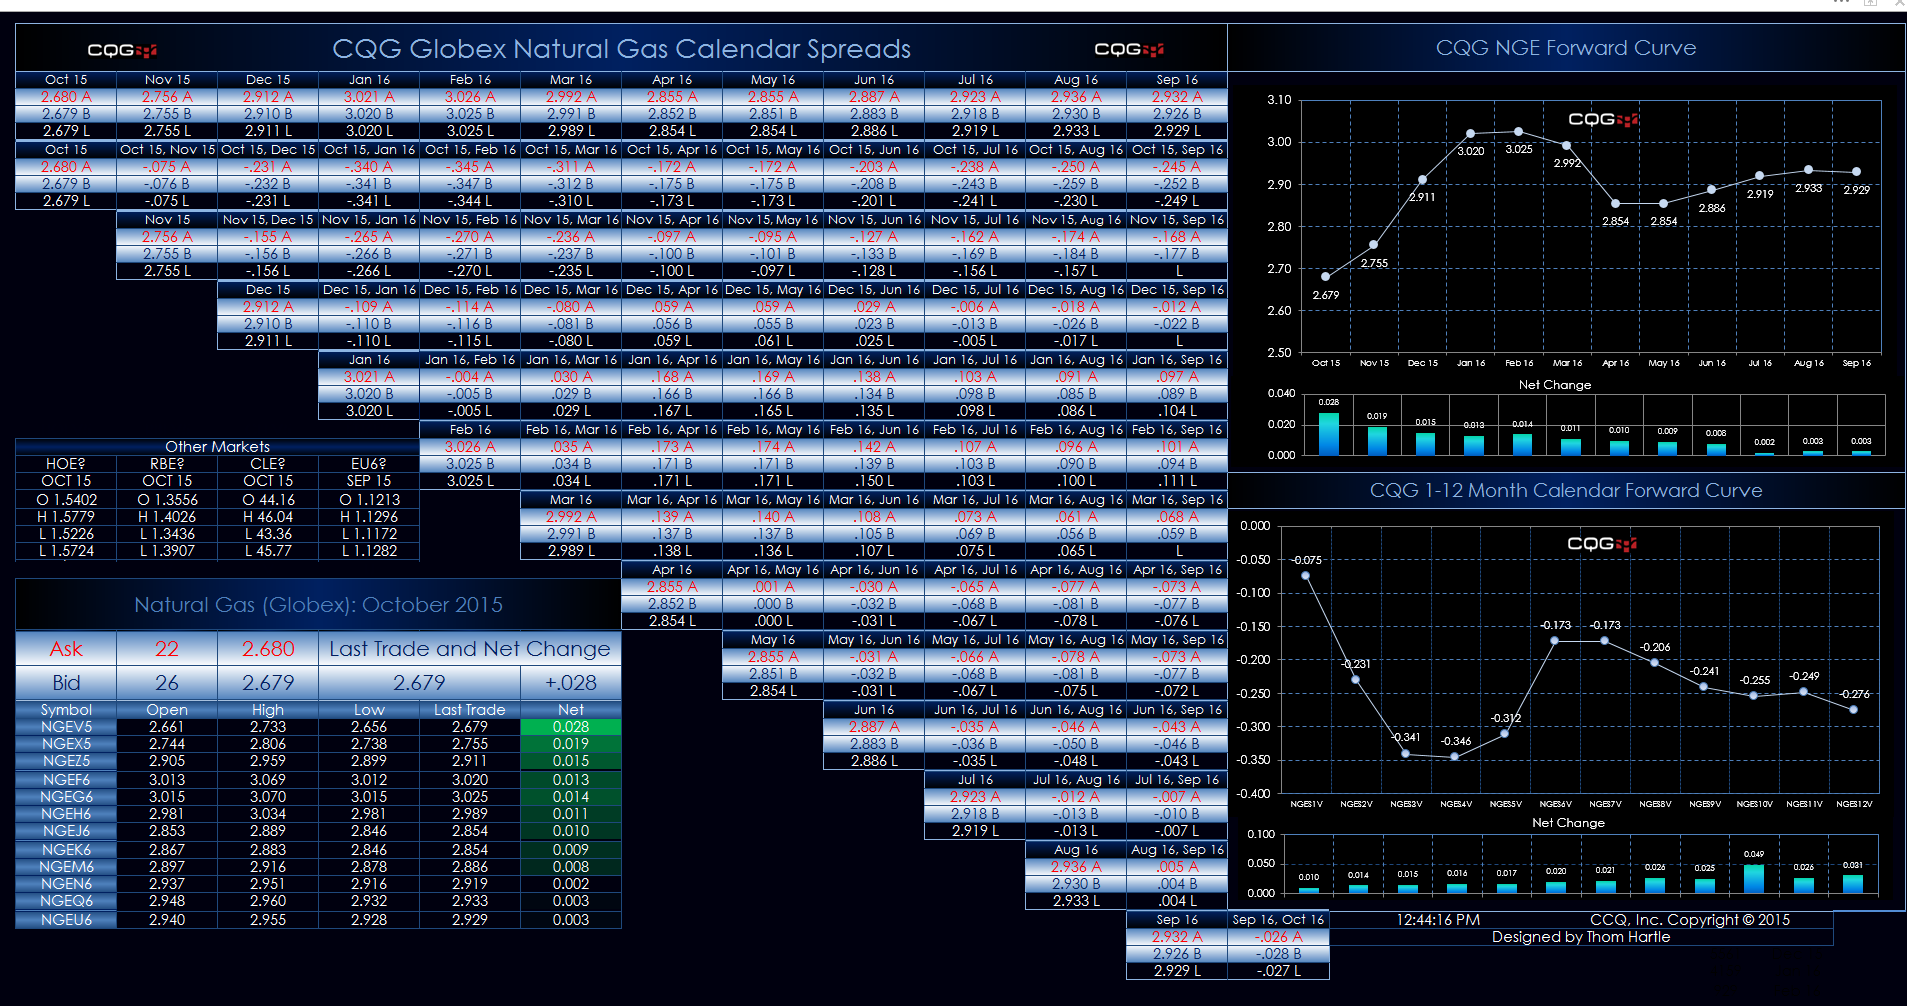
This Microsoft Excel® spreadsheet uses the CQG Toolkit to pull in natural gas market data traded on the CME Globex exchange. It uses a matrix style presentation with the outrights displayed along… more
You can use Microsoft Excel® and data from CQG to expand the features of your own market display dashboards. This powerful combination can be tailored to your specific needs. This article shows… more
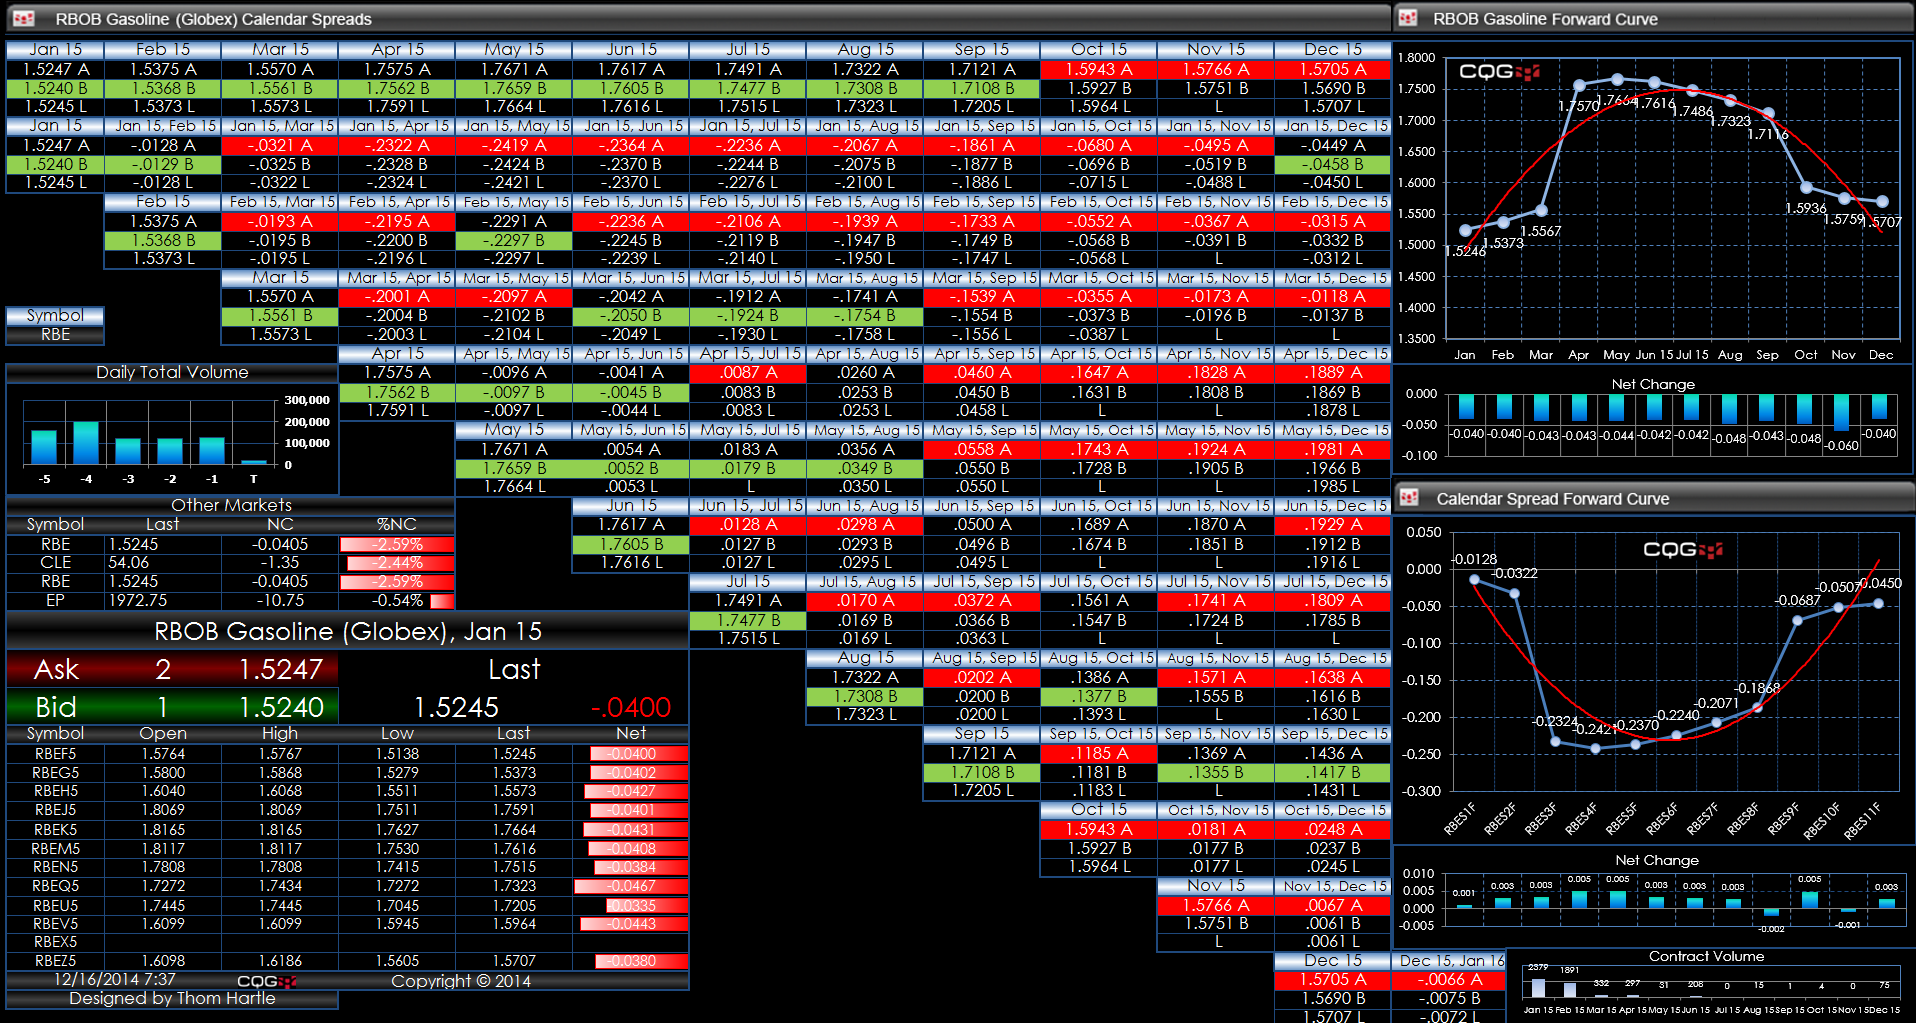
This Microsoft Excel® spreadsheet uses a matrix format to show the RBOB gasoline market traded on the CME Globex electronic trading platform.
This dashboard screen capture shows the inside… more
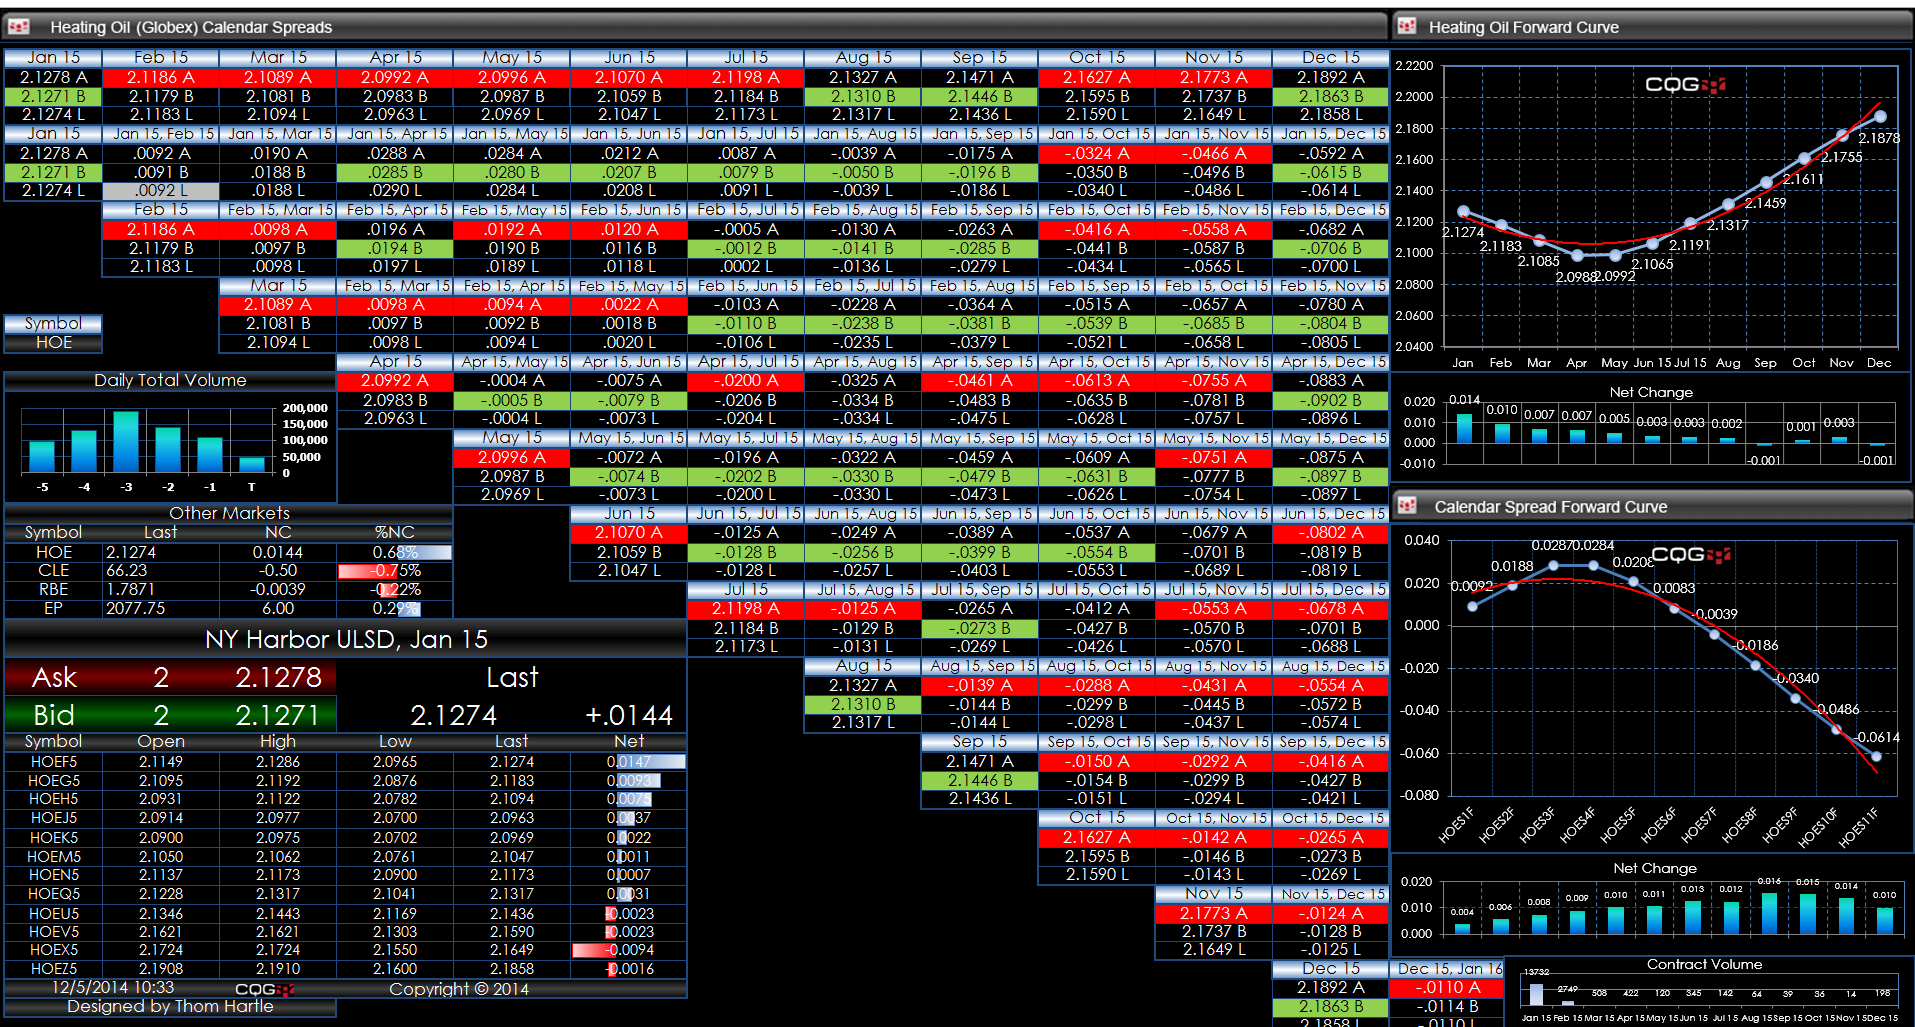
This Microsoft Excel® spreadsheet uses a matrix format to show the heating oil market traded on the CME Globex electronic trading platform.
This dashboard screen capture shows the inside… more
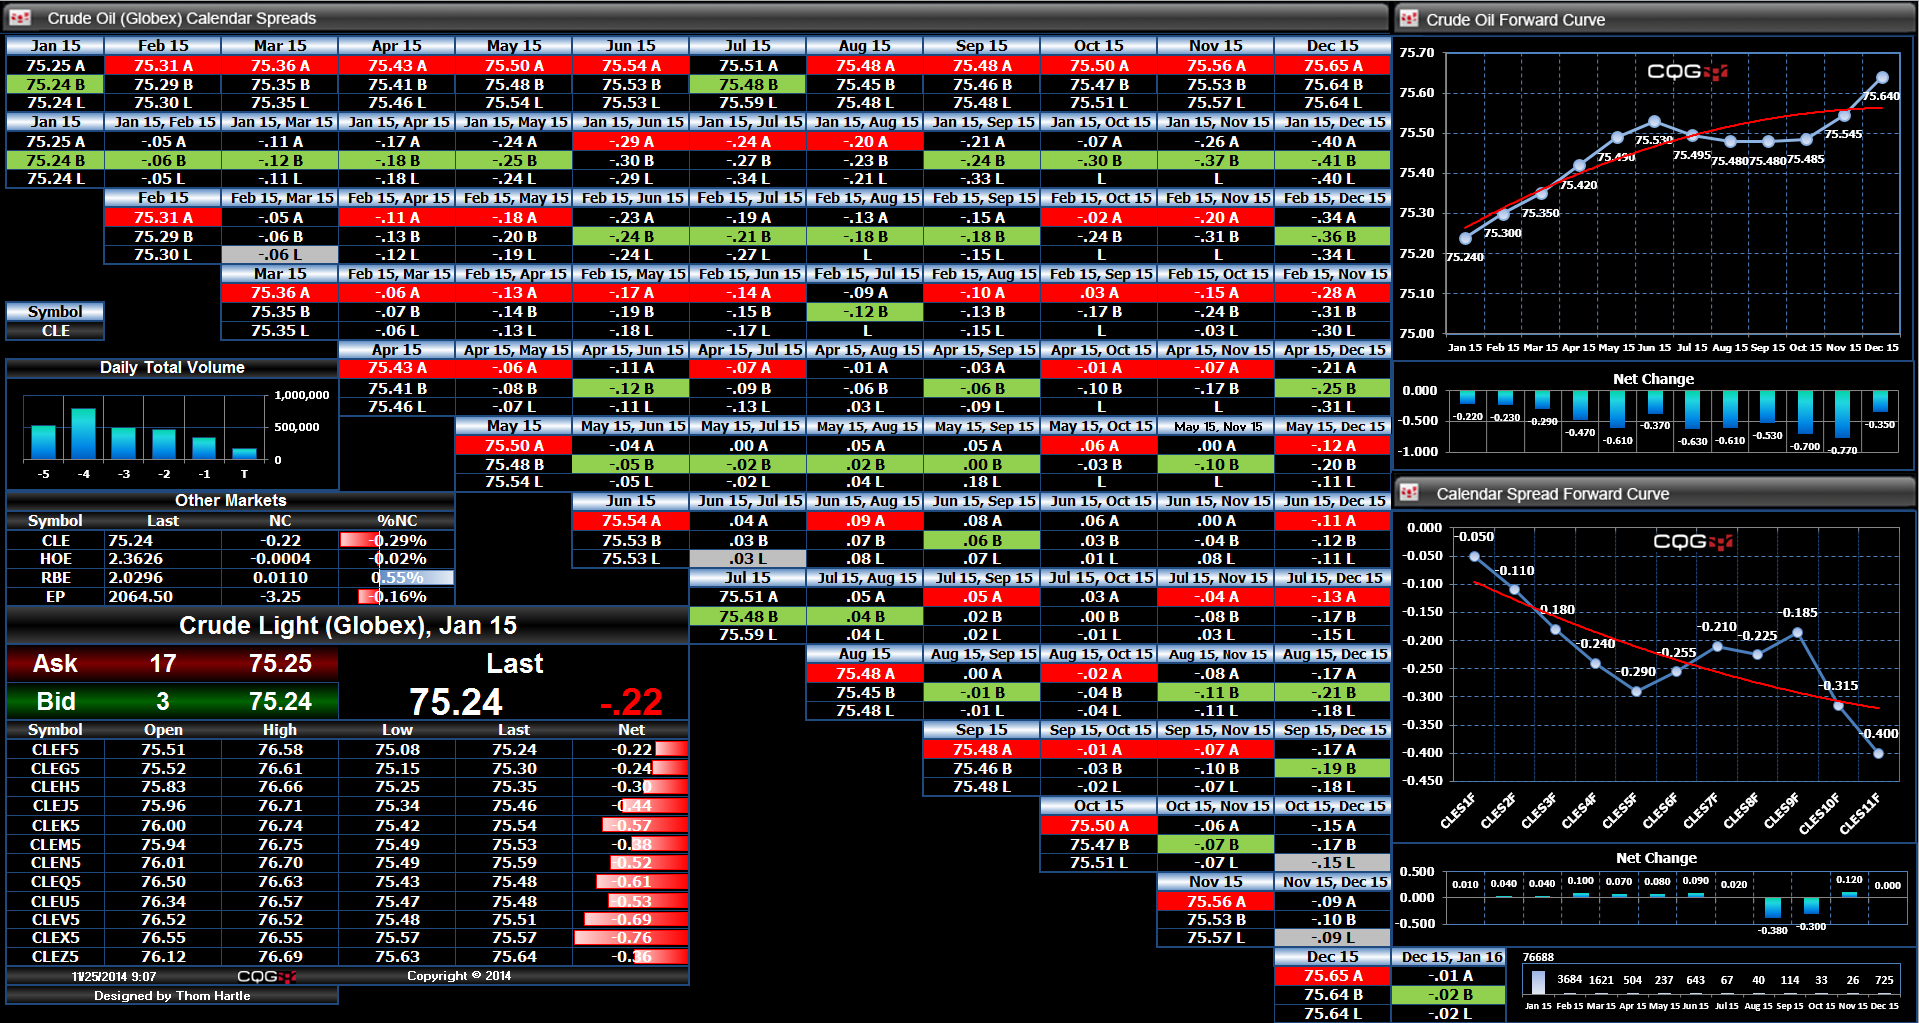
This Microsoft Excel® spreadsheet uses a matrix format to show the crude oil market traded on the CME Globex electronic trading platform.
This dashboard screen capture shows the inside… more
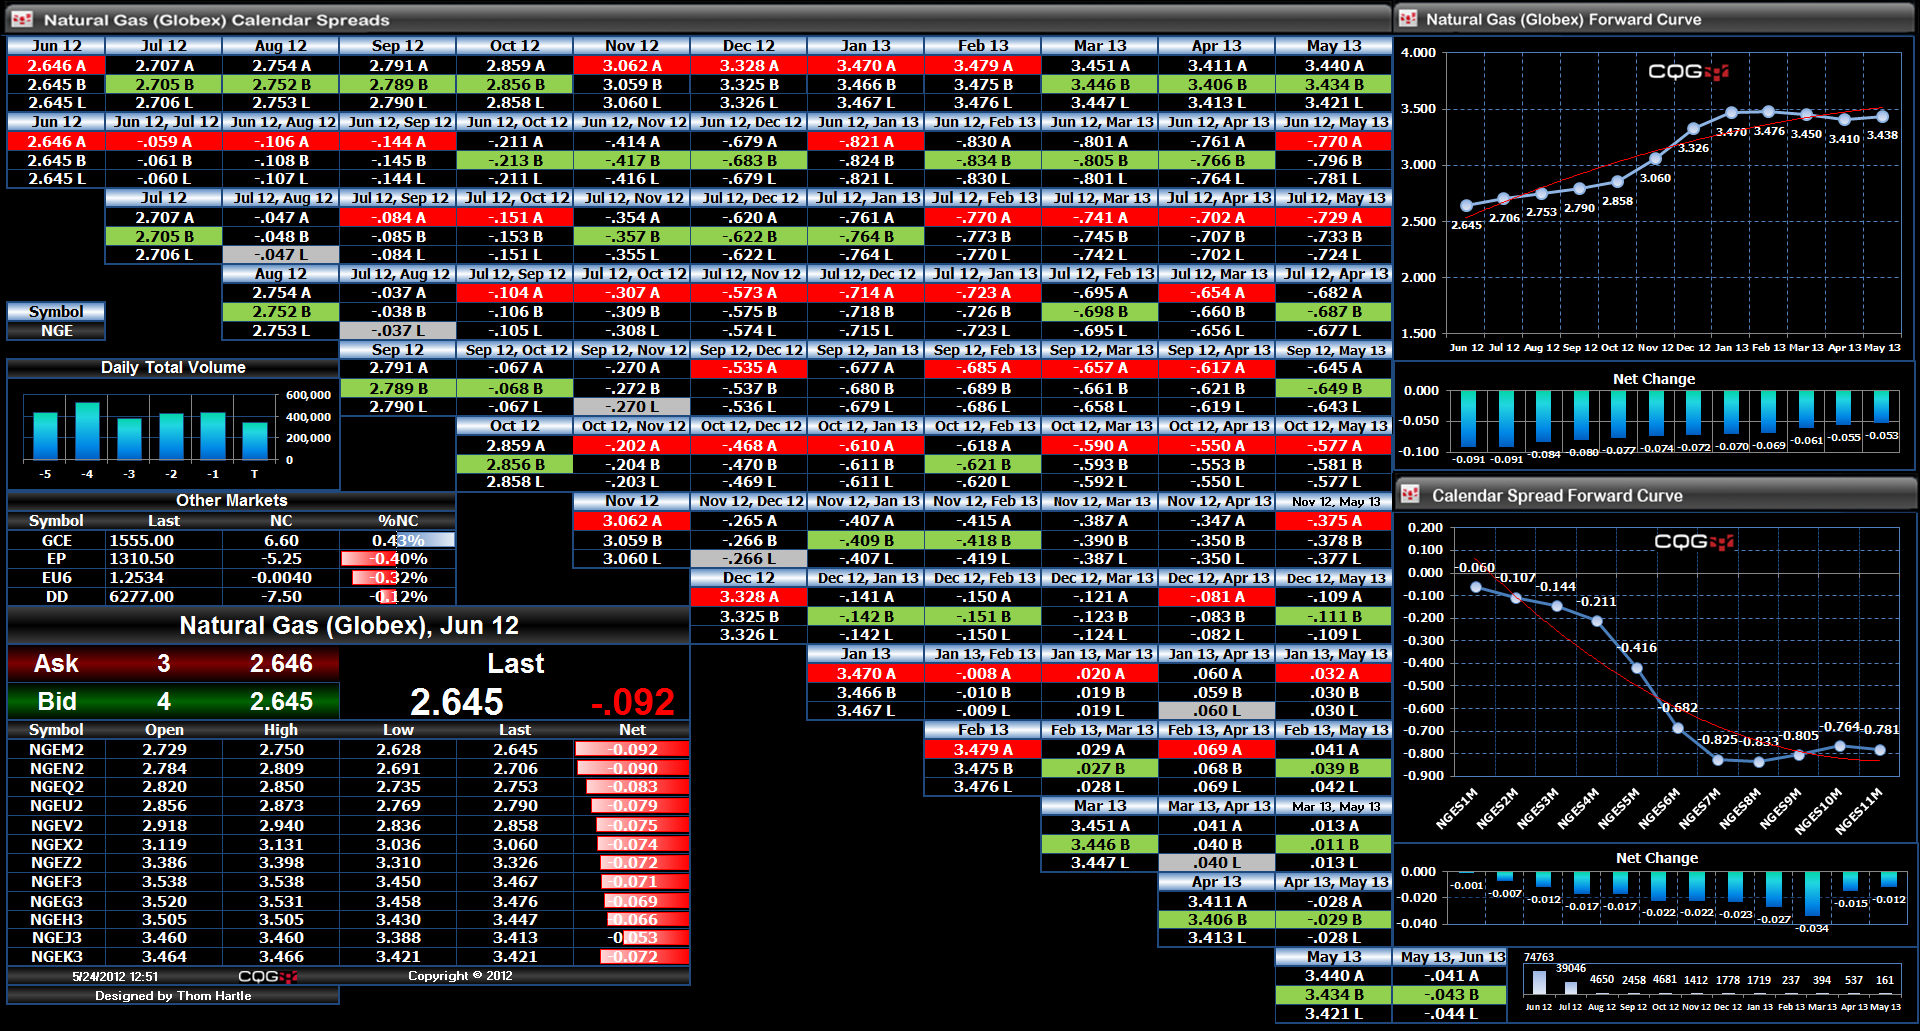
This Microsoft Excel® spreadsheet uses a matrix format to show the natural gas market traded on the CME Globex electronic trading platform.
This dashboard screen capture shows the… more
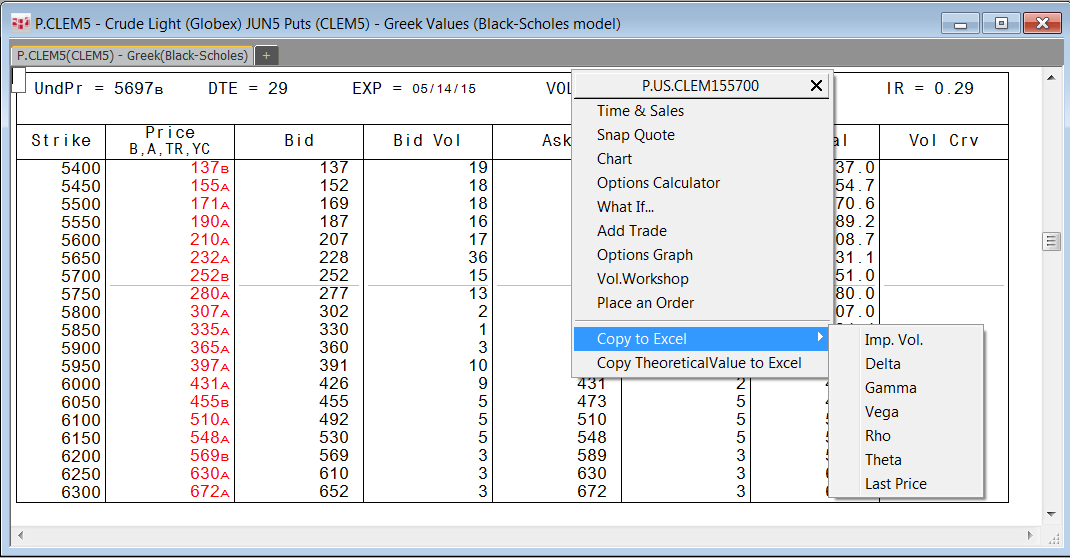
To access the RTD feature in CQG Trader, please contact your FCM. (CQG Trader RTD only works with 32-bit Excel).
This spreadsheet displays the current market data, last price, best bid, and… more