Pull historical spread data into Microsoft Excel® using RTD formulas with this sample spreadsheet. It not only pulls open, high, low, and close values into Excel, but also a study, the simple moving average of the spread.
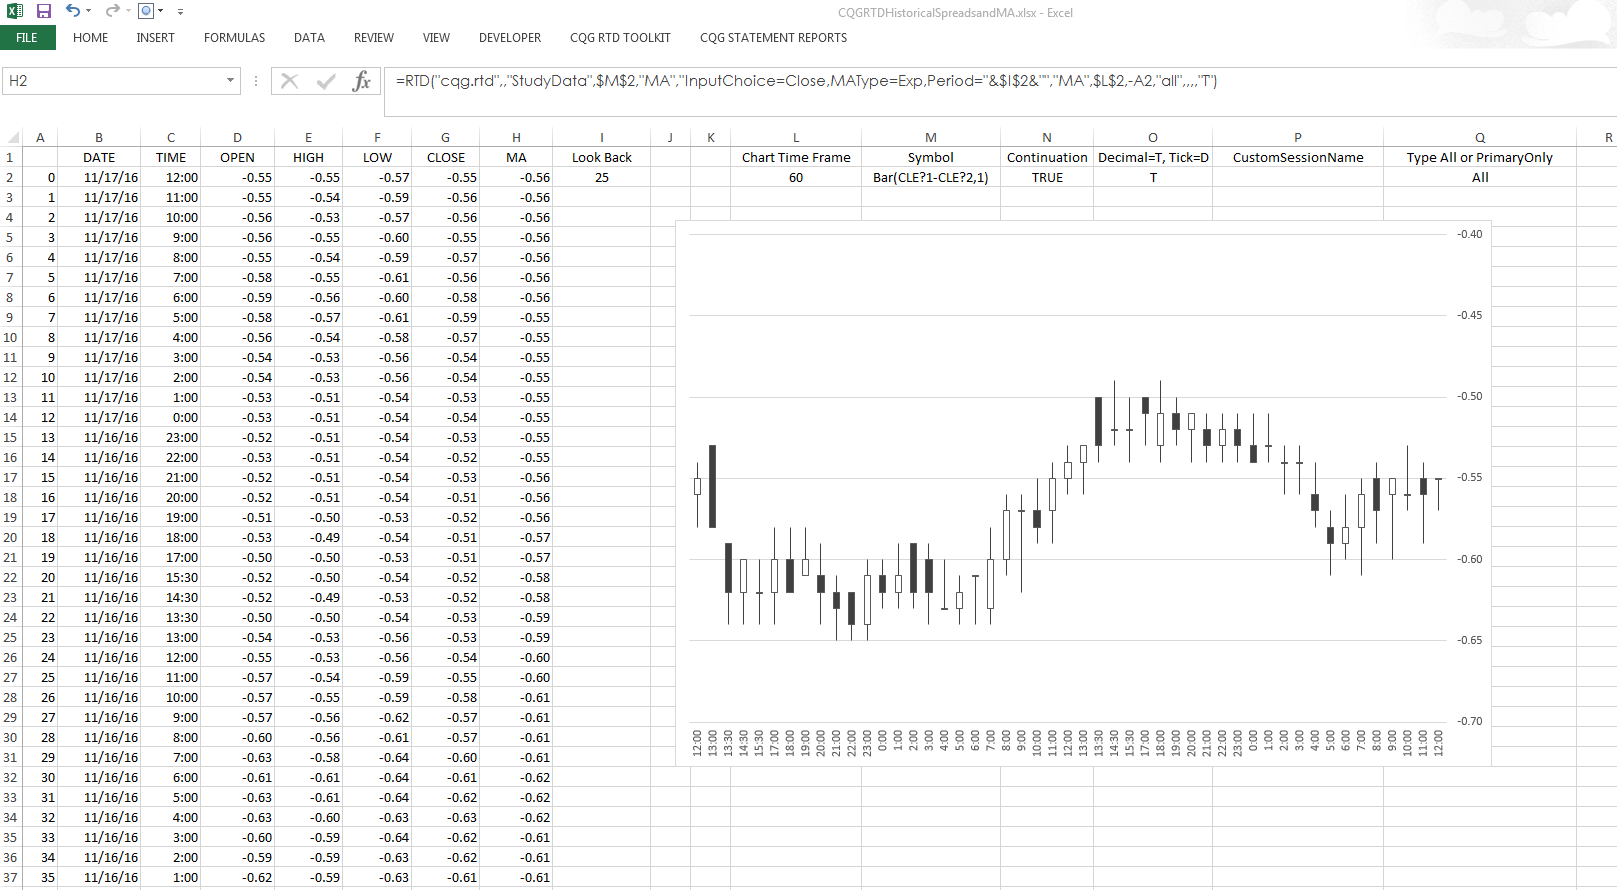
To pull in the data, we used the spread bar symbol:
Bar(CLE?1-CLE?2,1)
This symbol calls for 1-minute interval snapshots of the spread for determining the open, high, low, and close of the spread bar.
You can change the spread symbol, the time frame, including using a continuation setting, and the look-back period for the moving average.
Read more about spread bars
Requires CQG Integrated Client or CQG QTrader, data enablements for all symbols used in the spreadsheet, and Excel 2010 or higher.