This Microsoft Excel® spreadsheet uses a matrix format to show the crude oil market traded on the CME Globex electronic trading platform.
This dashboard screen capture shows the inside market for each of the outright contracts along the top row. For each contract, the current best bid, best ask, and last traded prices are displayed. Color formatting is used. If the latest quote is a new ask price, then it is colored red; if the latest quote is a new bid price, then it is colored green; and if the latest quote is an actual trade, then it is colored silver. The color-coding highlights which side of the market traders are working. If there is more red displayed, that indicates traders are aggressively offering the market. If there is more green displayed, that indicates more traders are aggressively bidding the market. An increase in silver indicates traders are executing trades, not placing bids or offers.
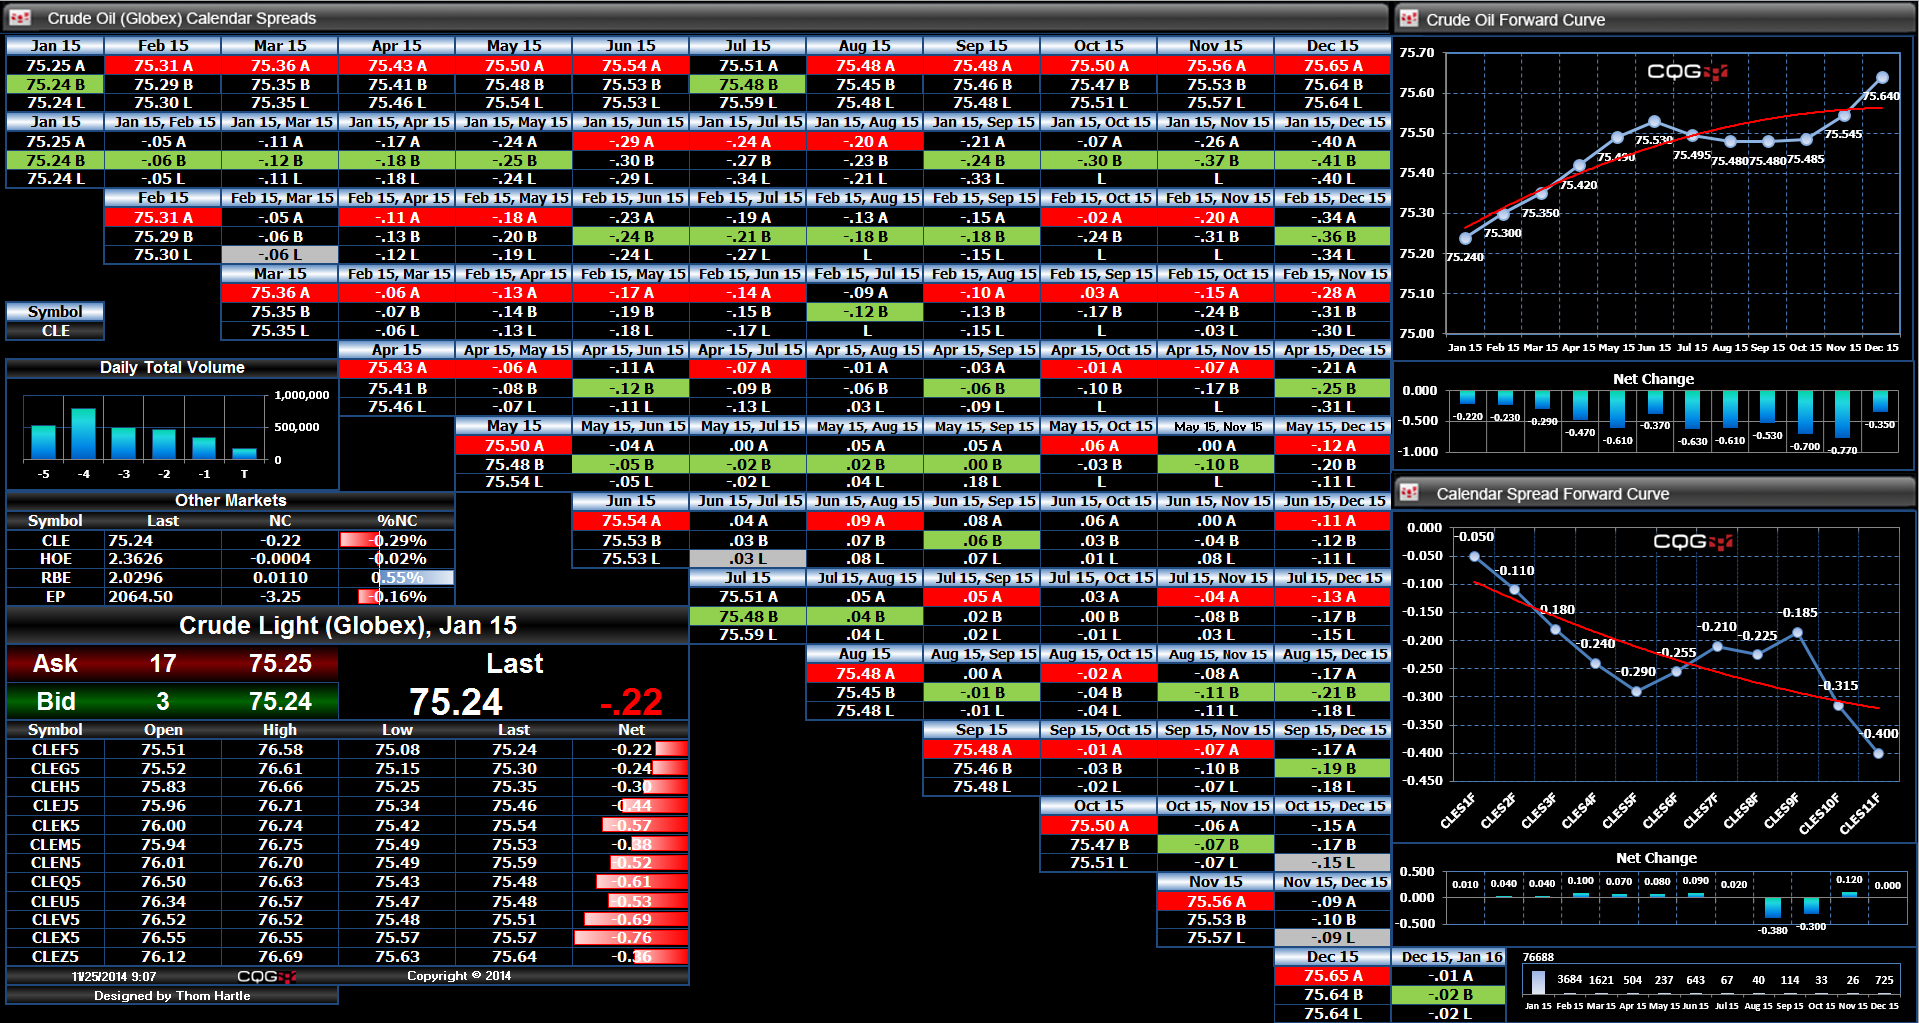
The start of each row is the inside market for each outright contract followed by the inside market for each exchange-traded calendar spread. For example, the second row starts with the inside market for the June delivery crude oil contract. Next is the inside market for the June/July calendar spread. Next is the June/August calendar spread, and so on out to the one-year calendar spread, which is the June/May calendar spread.
The next row down starts with the July crude oil contract and the calendar spreads are July/August, July/September, etc.
On the right-hand side are two forward curves. The top forward curve displays the outright contracts. The chart uses the last traded price unless the last traded price is outside of the best bid and best ask prices. If this is the case, then the midpoint between the best bid and best ask prices is used for the curve.
The next forward curve displays market data for the calendar spreads from the second row in the matrix display. The red line is a second order polynomial best-fit regression line. At the very bottom of the spreadsheet is a histogram chart showing today's traded volume by each outright contract.
On the left-hand side is the total traded volume for the last six sessions, as well as a small quote window detailing other markets. The bottom section is an overview of the crude oil market, it shows the current best bid and ask prices, size, and last traded price. The open, high, low, and last for each contract out one year are displayed. Finally, the net changes are highlighted using relative data bars to indicate which contracts are moving the most for the session.
Requires CQG Integrated Client, data enablements for all symbols displayed in this spreadsheet, and Excel 2010 or more recent.