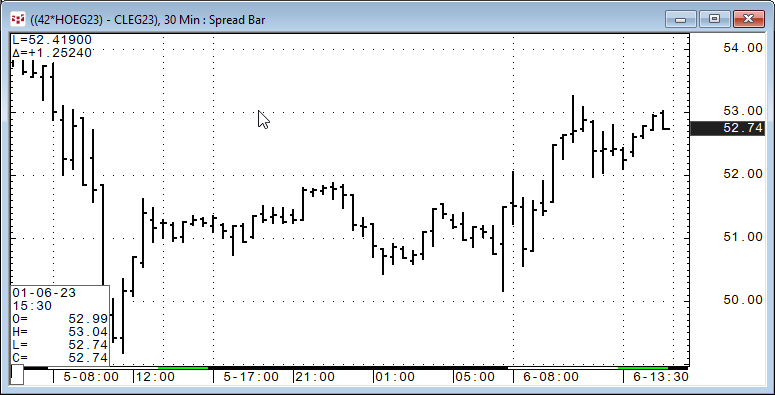
The Spread Bar chart displays spread bar values based on a user set parameter for snap shots at certain intervals.
This is a superior method to simply plotting the spread prices. For… more
The Spread Bar chart displays spread bar values based on a user set parameter for snap shots at certain intervals.
This is a superior method to simply plotting the spread prices. For… more
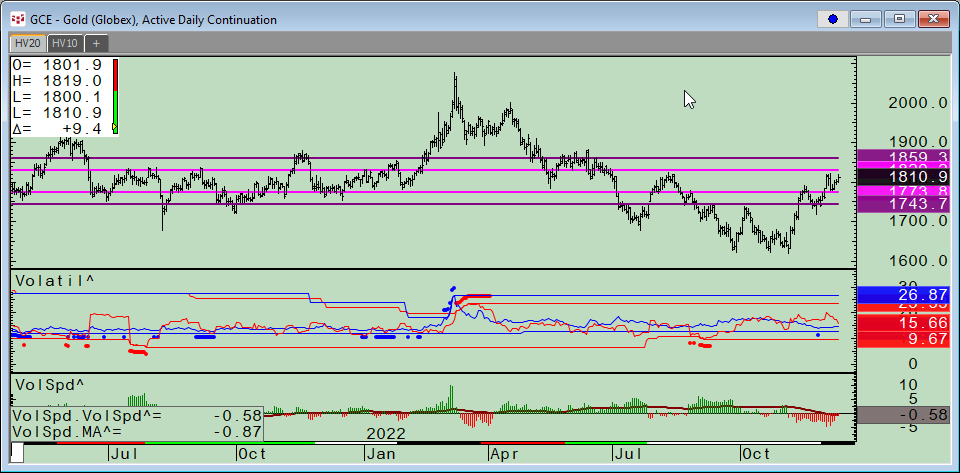
CQG Product Specialist Stan Yabroff designed a CQG page for customers to track and analyze a market’s implied volatility and historical volatility. This post details the features and functionality… more
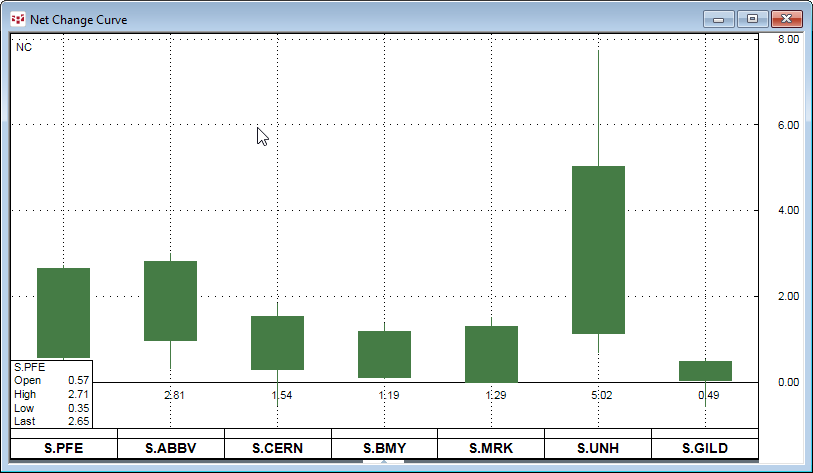
CQG Version 22.12.8002 introduces CQG’s Net Change Curve Chart.
This chart type enables you to compare the current session’s performance of a collection of markets. The above image… more
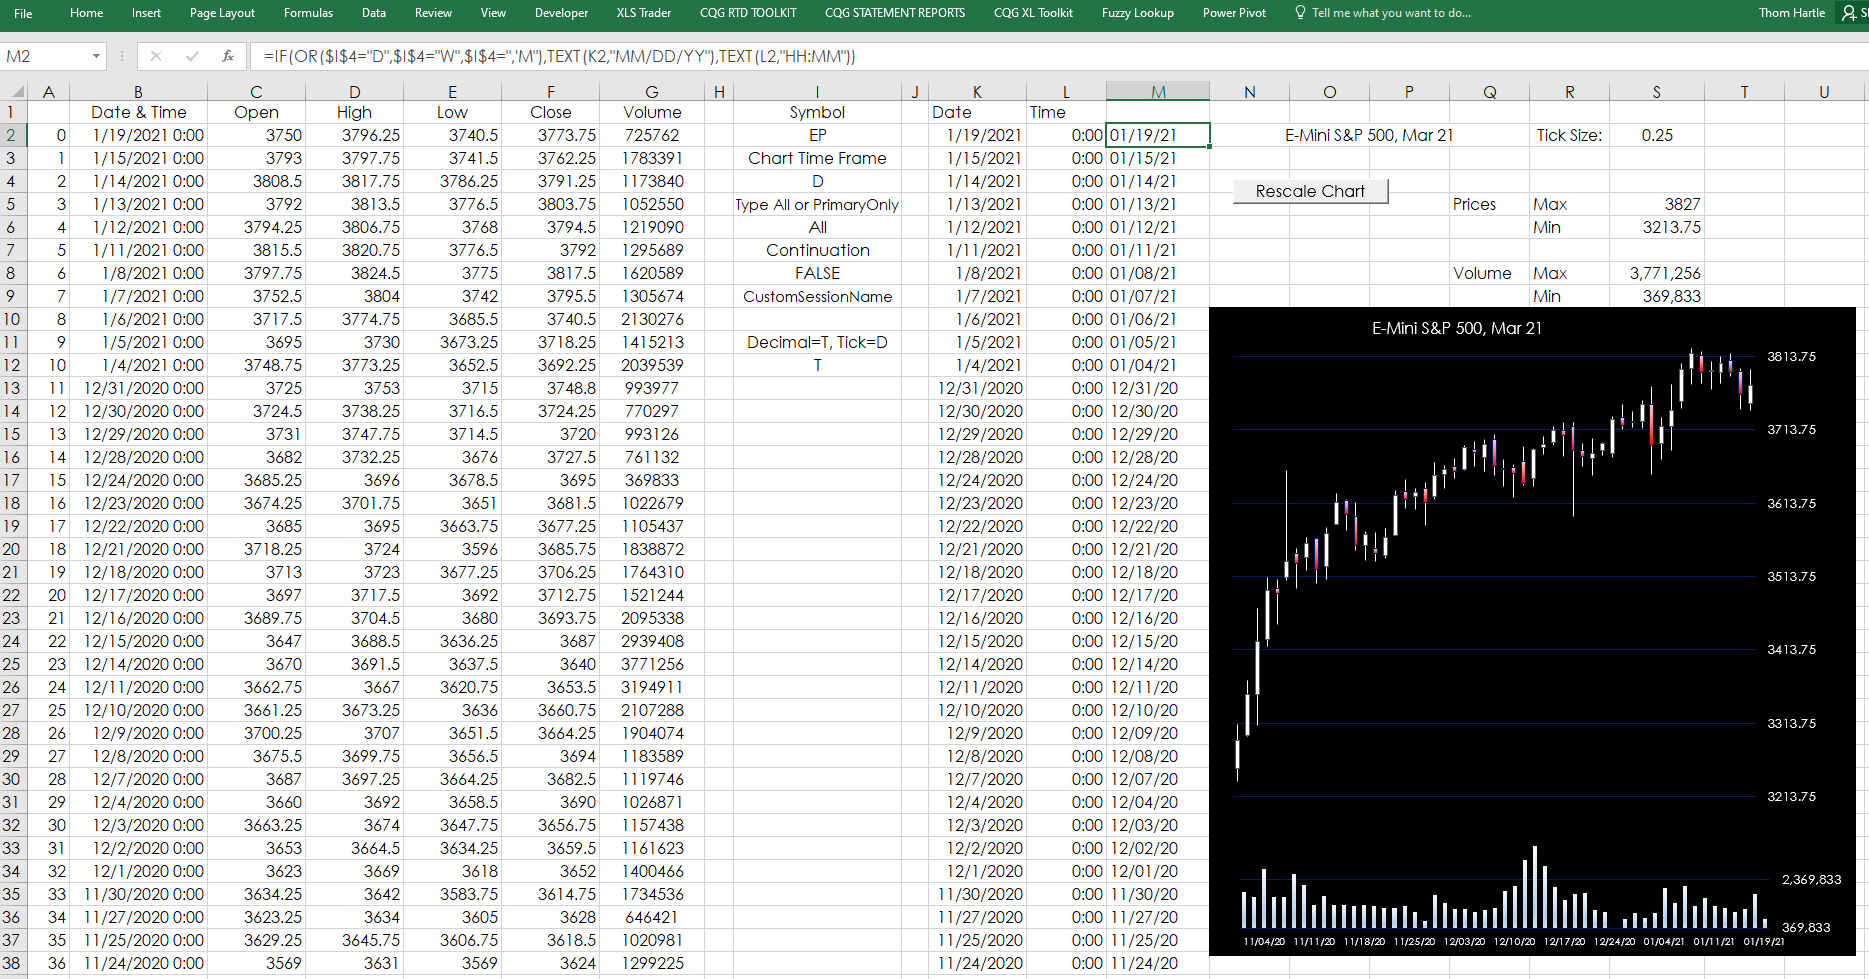
Perhaps you are pulling market data into Microsoft Excel using RTD functions from CQG and you would like to chart the data in Excel. When you setup the chart you would likely use “Auto” for the… more
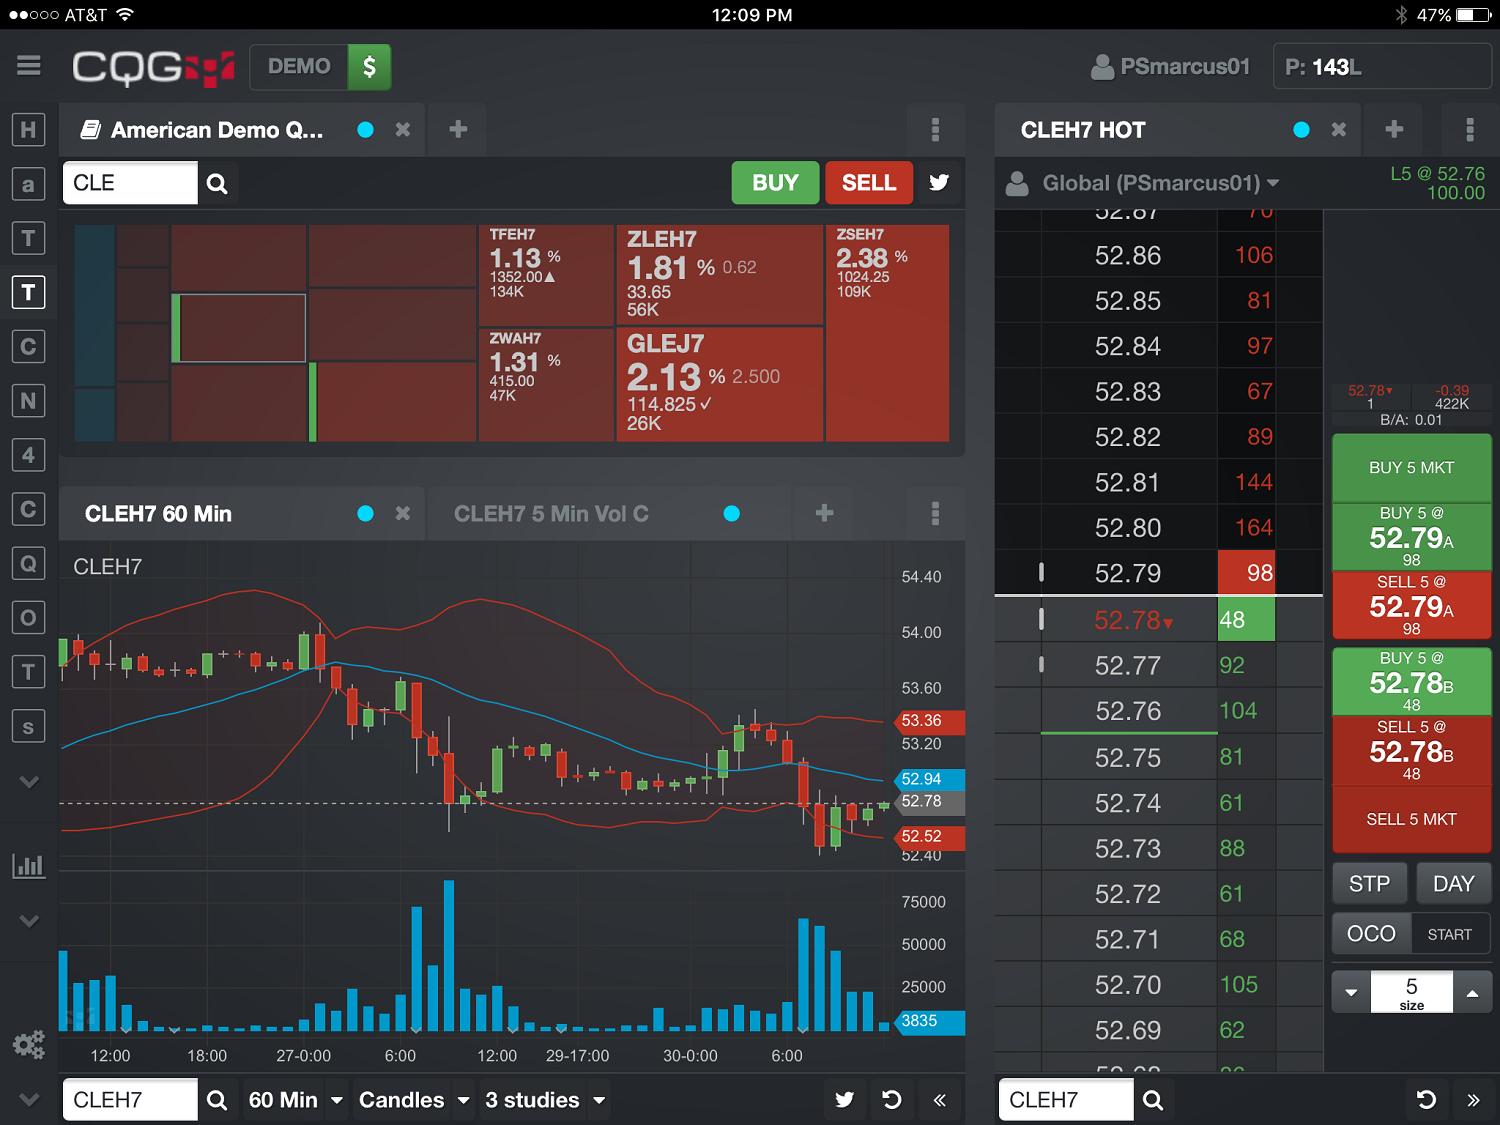
This CQG M dashboard layout displays a portfolio of symbols from the Americas (available with a subscription to the CME Globex feed on CQG) in a heat-map style. Tapping on a quote pushes the… more