Perhaps you are pulling market data into Microsoft Excel using RTD functions from CQG and you would like to chart the data in Excel. When you setup the chart you would likely use “Auto” for the high and low values for scaling the vertical axis. However, Excel isn’t as smart as you would want and often will use zero for the minimum value and the resulting chart is somewhat flat. Below is the daily chart for the E-mini S&P futures contract displayed in Excel.
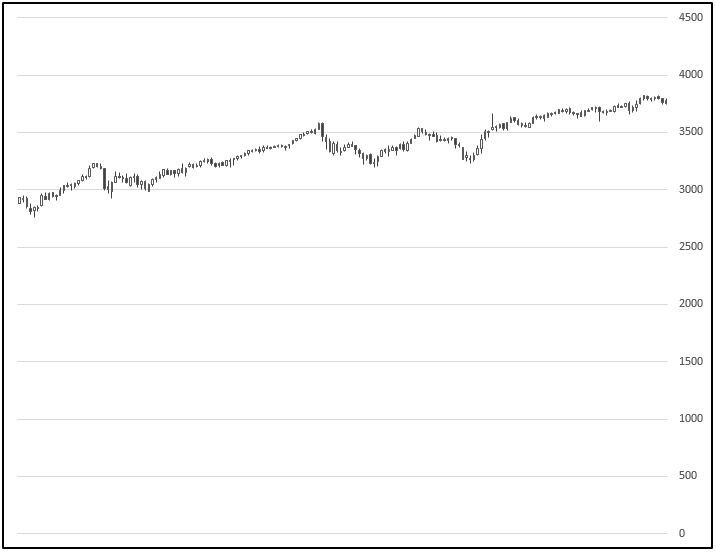
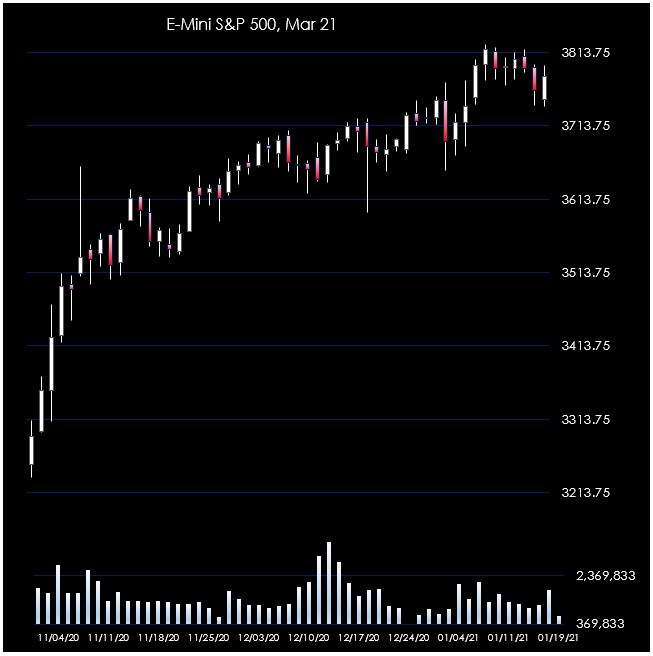
A simple Macro can be used to rescale the chart to use minimum and maximum values for the price axis range. The downloadable sample at the bottoms of the article is detailed in this post.
The Macro is using the With Statement, which lets you specify an object once for an entire series of statements:
With Worksheets("Sheet1").ChartObjects("ChartOne").Chart.Axes(xlValue)The chart we want to rescale is on tab “Sheet1”, the chart is named “ChartOne” and the macro is setting the axis values.
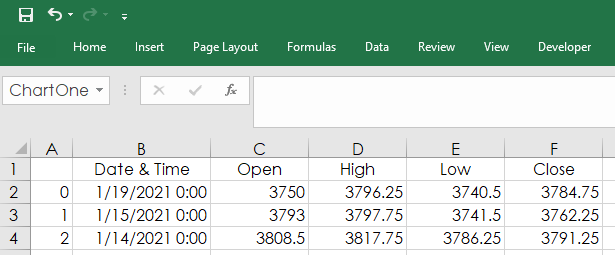
When creating a chart, you select data and plot the chart then the chart will have a name, such as Chart 1 for the first chart. Set the name of the chart to “ChartOne” in the top left hand corner of Excel, so the macro will only modify this chart.
The With Statement allows you to use multiple statements:
With Worksheets("Sheet1").ChartObjects("ChartOne").Chart.Axes(xlValue)
.MaximumScale = Worksheets("Sheet1").Range("S5")
.MinimumScale = Worksheets("Sheet1").Range("S6")
The maximum scale value is set by the value in cell S5, which is the maximum value in the High column plus 10 times the tick value and the minimum scale value is in cell S6 and is the minimum value in the Low column minus 10 times the tick vale.
The downloadable sample includes a volume column and that is ChartTwo. The VBA With Statement allows for nested With statements:
With Worksheets("Sheet1").ChartObjects("ChartTwo").Chart.Axes(xlValue)
.MaximumScale = Worksheets("Sheet1").Range("S8")
.MinimumScale = Worksheets("Sheet1").Range("S9")
Here is the entire macro:
Sub RescaleChart()
With Worksheets("Sheet1").ChartObjects("ChartOne").Chart.Axes(xlValue)
.MaximumScale = Worksheets("Sheet1").Range("S5")
.MinimumScale = Worksheets("Sheet1").Range("S6")
With Worksheets("Sheet1").ChartObjects("ChartTwo").Chart.Axes(xlValue)
.MaximumScale = Worksheets("Sheet1").Range("S8")
.MinimumScale = Worksheets("Sheet1").Range("S9")
End With
End With
End Sub
Another trick used in the charting sample is the Date/Time axis is only displayed on ChartTwo to save space. Also, it is formatted as text. Again, Excel does not scale the X-axis in a way that is efficient. Consequently, the X-axis scale if from column M. If the data is daily, weekly or monthly then the date is used. If the scale is intraday then the time value is used.
Once data is pulled into the spreadsheet click the Rescale Chart button and both charts will rescale.
Note that VBA and RTD functions cannot operate at the same time. So, you cannot add to the macro an event, such as if the Symbol is changed, then run the macro. RTD will not have time to update Excel and there will be an error. And, finally, Excel does not recognize RTD updates as an event. For example, if the high for the session is surpassed you cannot write a macro that would recognize that as an event and execute the macro.
Requires CQG Integrated Client or QTrader and data enablements for the products. Strongly recommended: Microsoft Office Professional Excel 2016, 2019, 32 or 64-bits installed on your computer, not in the Cloud.