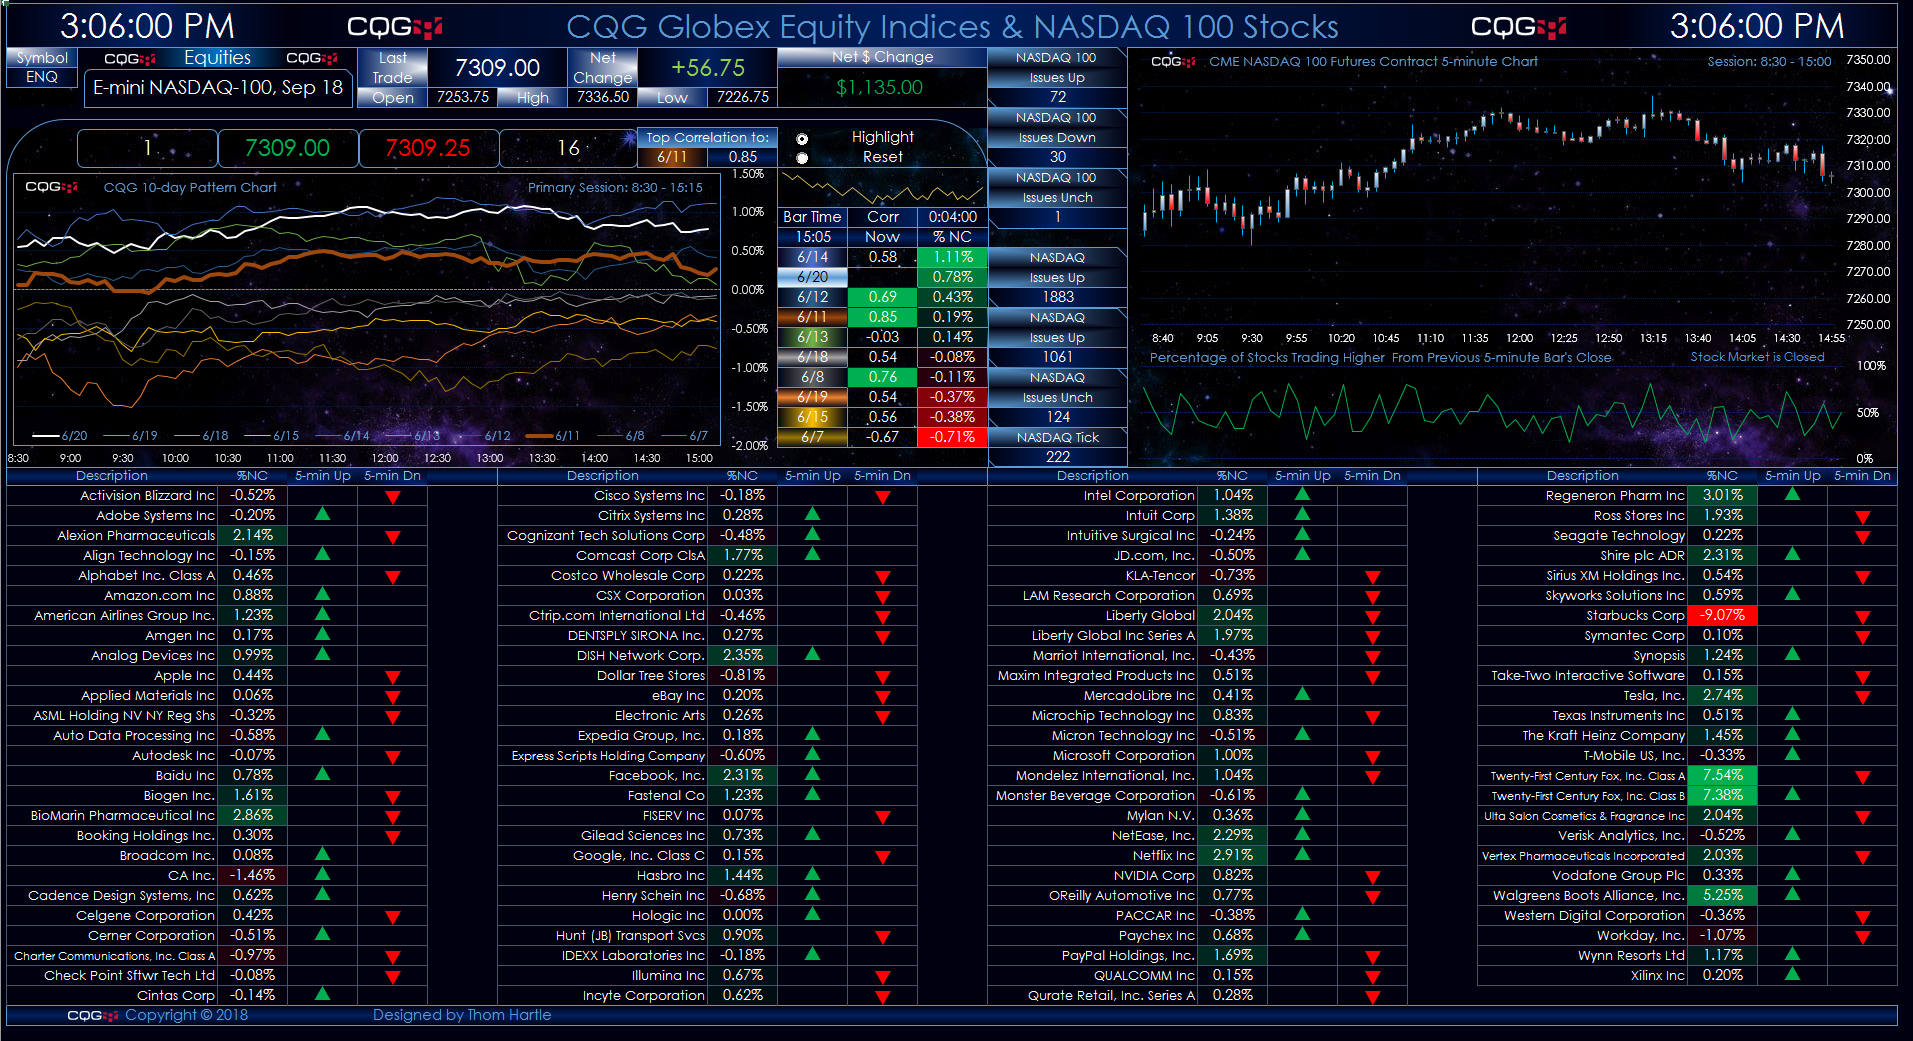
This Microsoft Excel® dashboard presents two charts of the Nasdaq-100 futures contract and market data for the one hundred stocks that are constituents of the Nasdaq 100 Index.
… moreWorkspaces
CQG customers who create their own custom studies can easily use RTD to pull custom study values into Excel.
There are only two unique requirements in the RTD formula for a custom study:… more
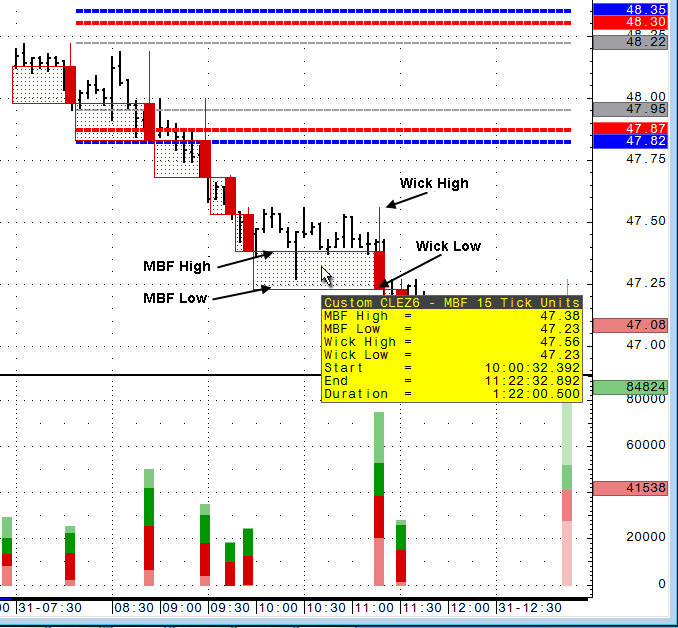
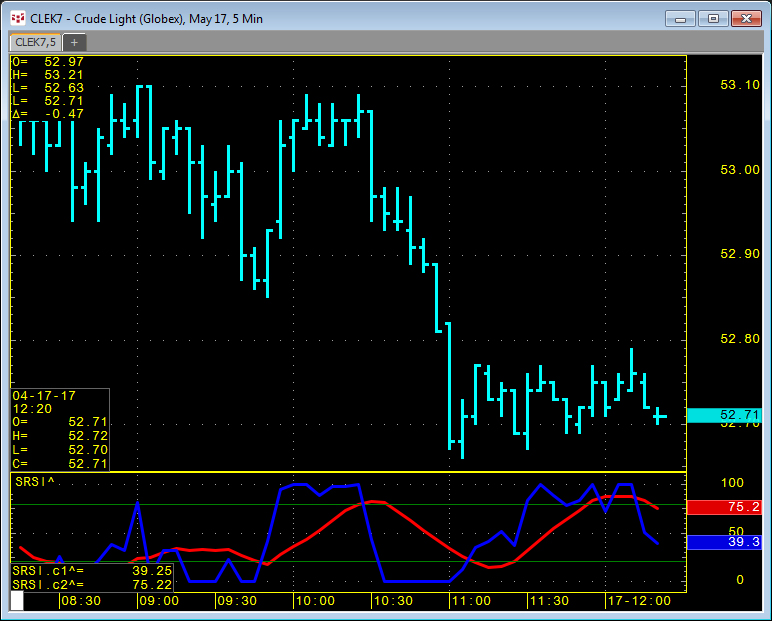
Mark B. Fisher, founder and CEO of MBF Clearing Corp, discussed his chart and study during a joint webinar with CQG. This article further explains the study and chart type,… more
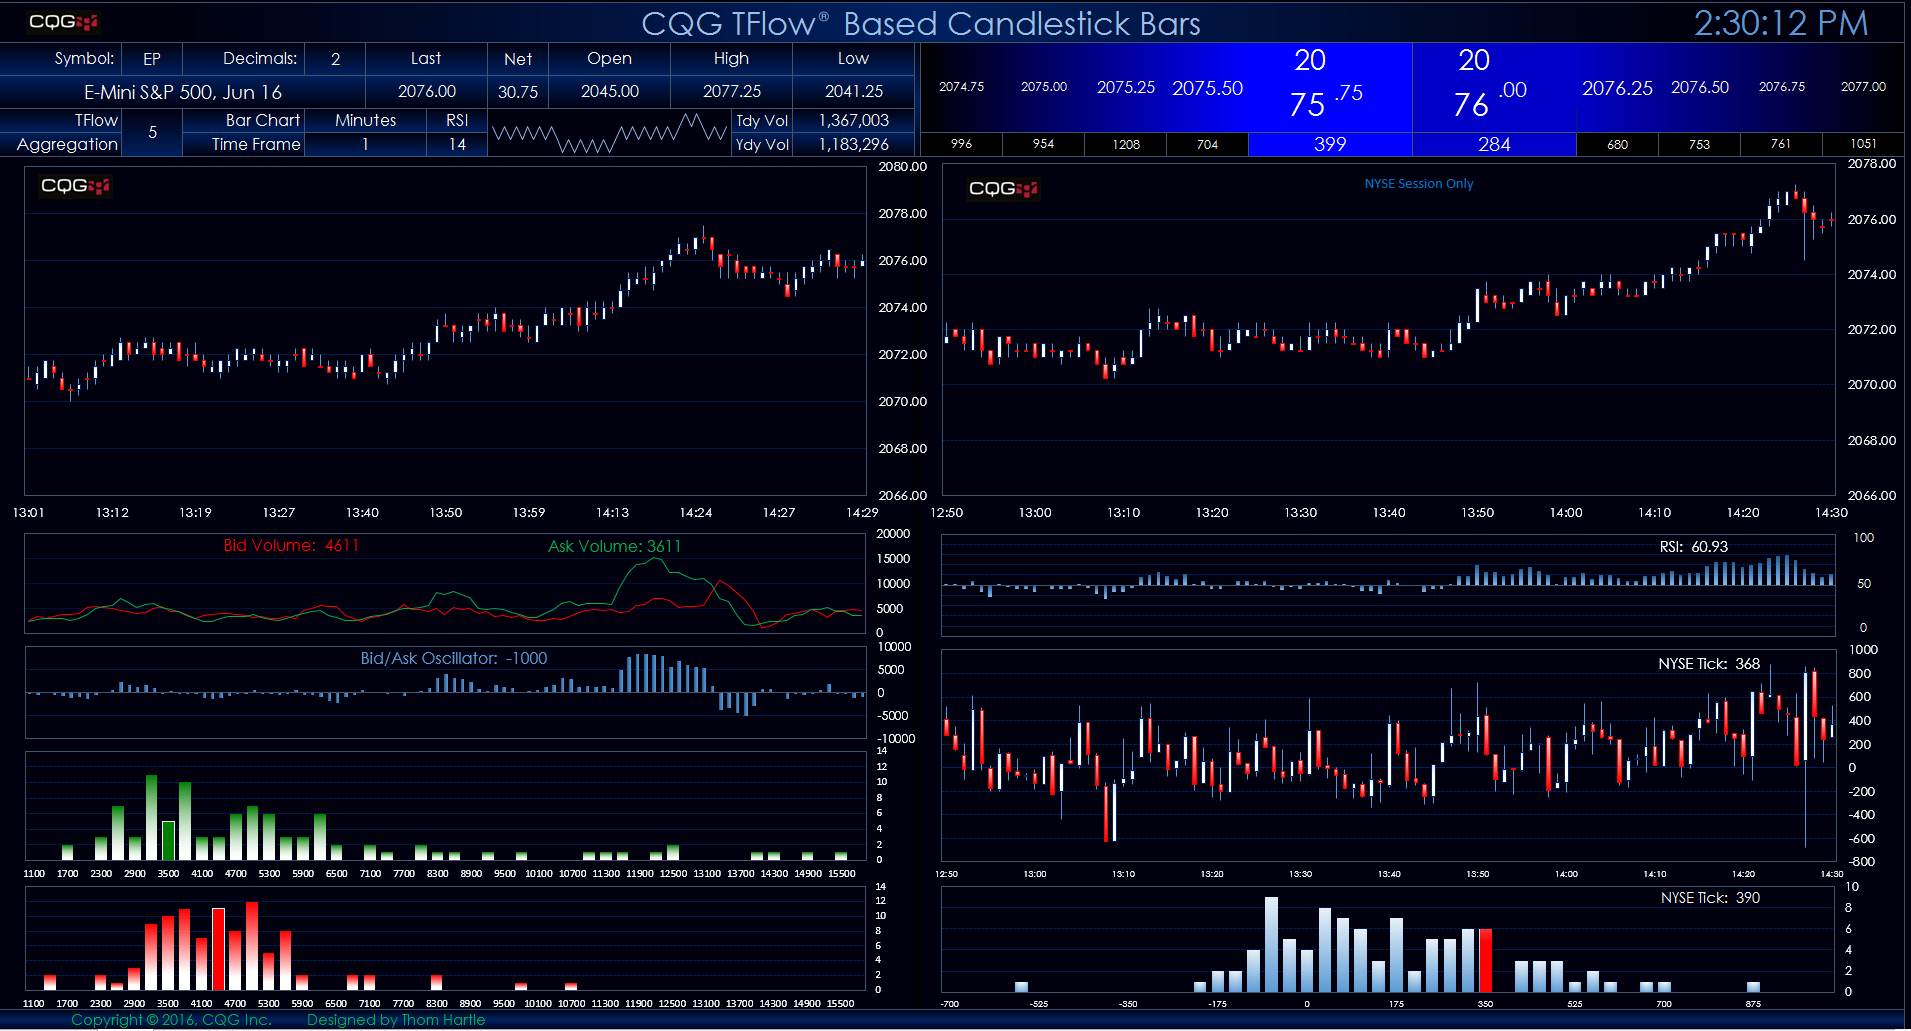
This Microsoft Excel® spreadsheet presents two views of the E-mini S&P contract. The left-hand view displays candlestick bars using CQG’s proprietary TFlow chart data. You can use the… more
CQG provides the ability to separate volume into trades executed at the best bid price and trades executed at the best ask price. This feature gives you more insight into market action because you… more

Powered by CQG FX, this Microsoft Excel® dashboard measures volatility by using the difference between the upper and lower Bollinger Bands and dividing the difference by the Moving Average. The… more

This Microsoft Excel dashboard measures volatility by using the difference between the upper and lower Bollinger Bands and dividing the difference by the Moving Average. The dashboard then sorts… more
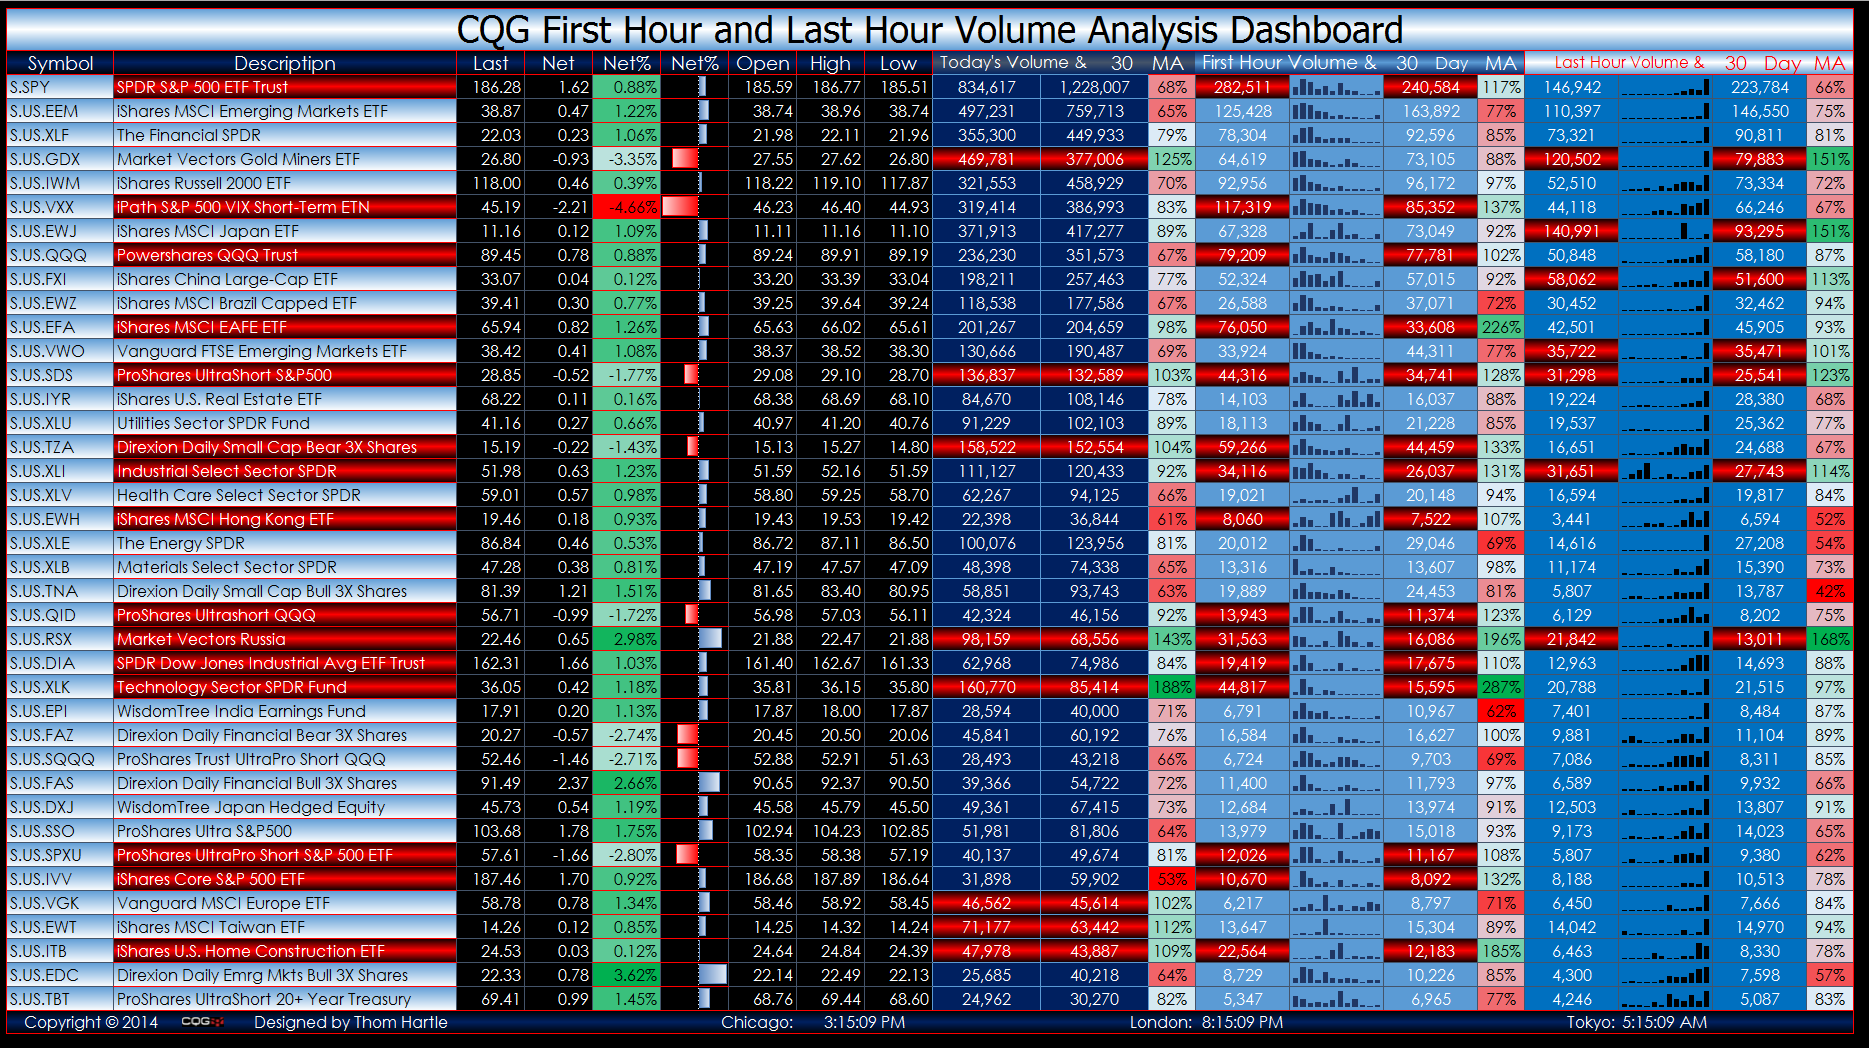
This Microsoft Excel dashboard is used to track the performance of a collection of Exchange-Traded Funds (ETFs).
The market information displayed is the last price, net change, the… more
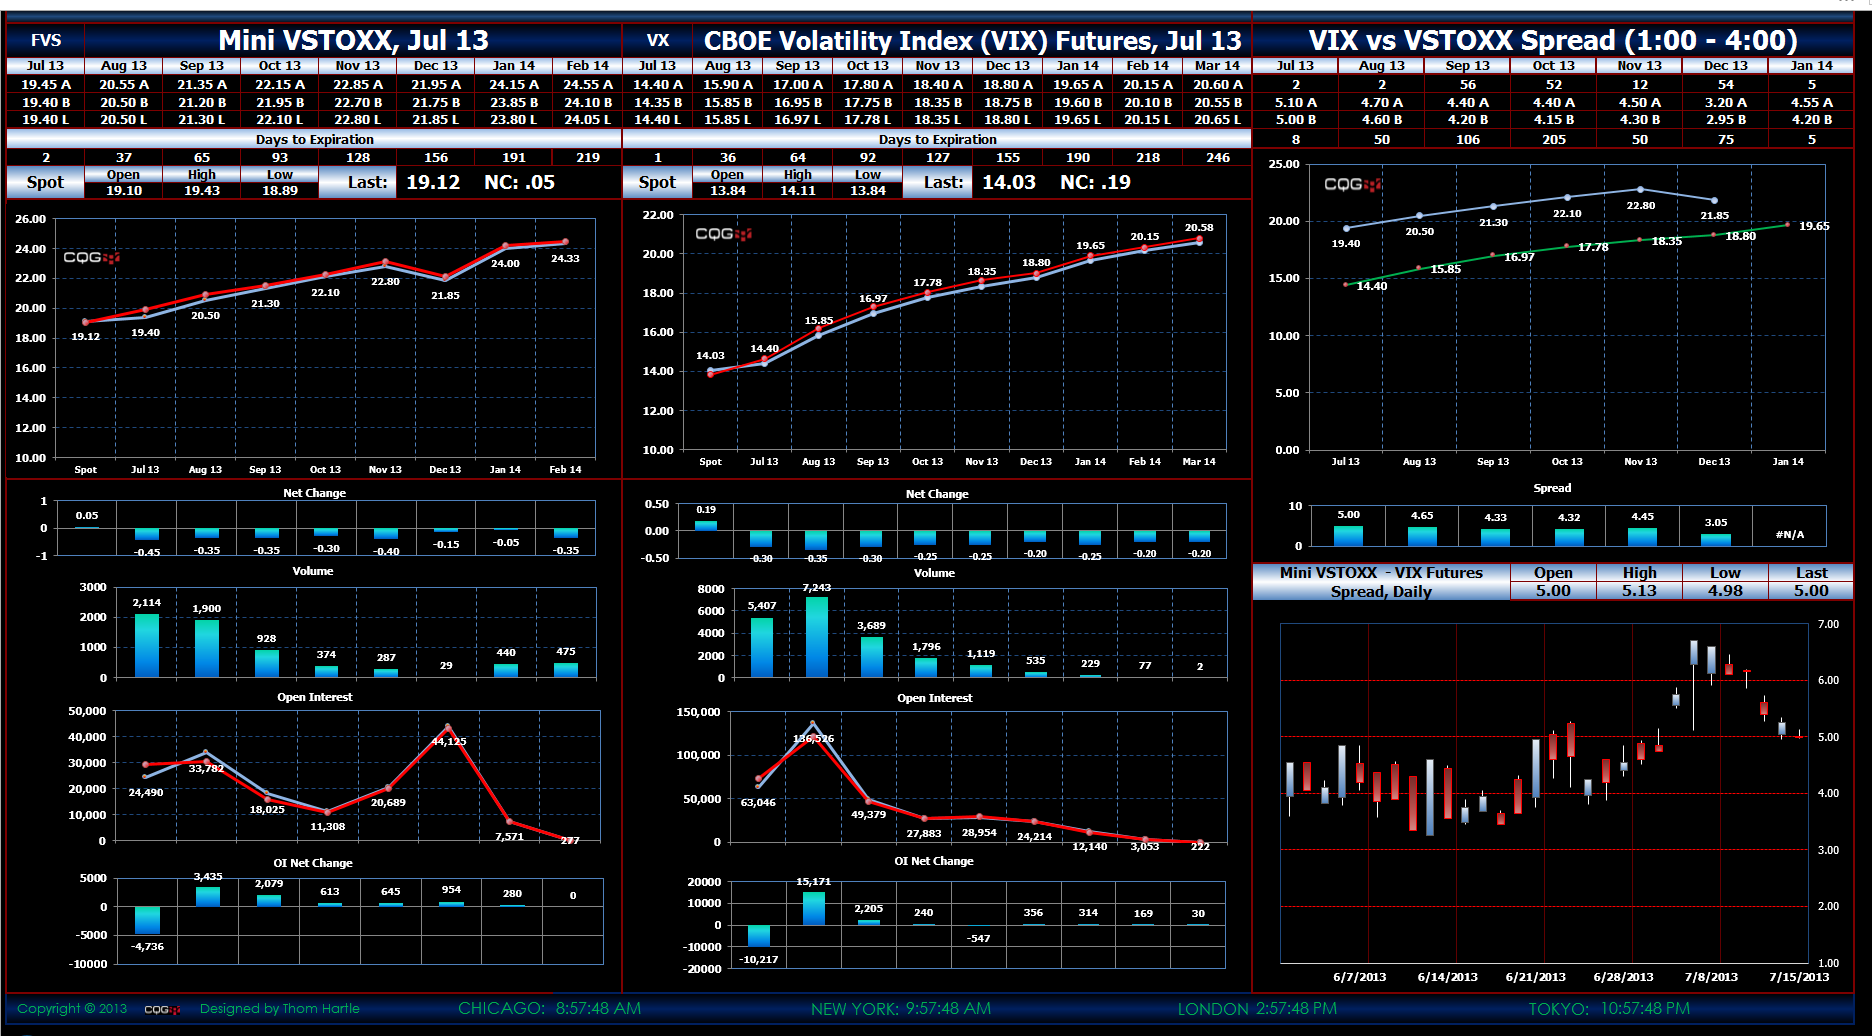
This dashboard tracks the spread between the two volatility futures contracts, including the forward curves.
Please install the CQGVIXVSTOXX component pac before running the… more