
The CQG RTD Toolkit Excel Add-in is installed with CQG QTrader. The Account Summary dialog has been updated to include a Currency field. Use the currency symbol found on the Orders & Positions… more
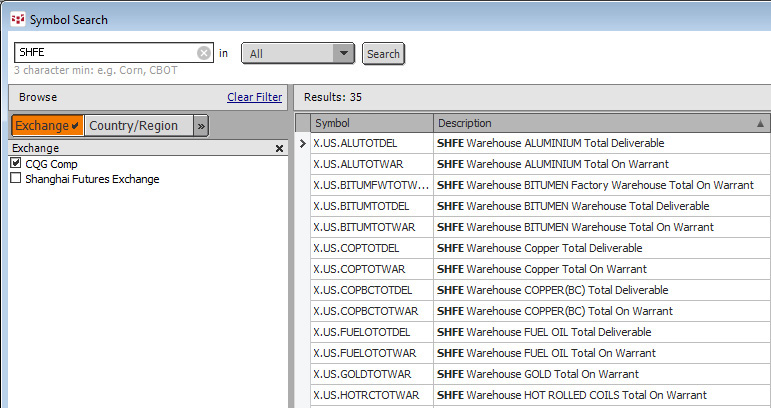
The weekly warehouse statistics from the Shanghai Futures Exchange are now available via CQG. The data is listed under the CQG Comp group. An easy way to locate the symbols is search in the CQG… more
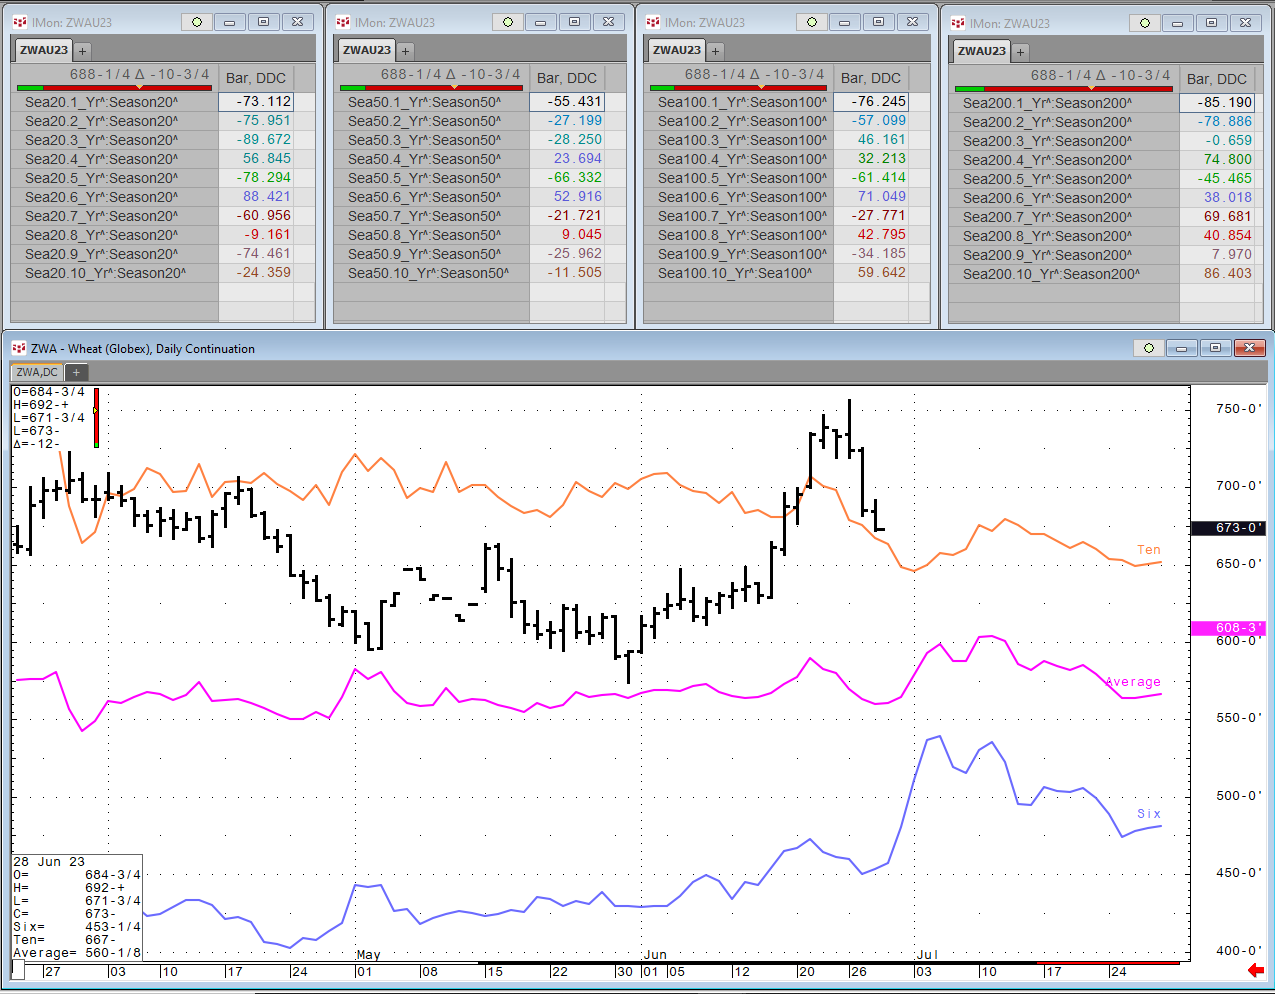
Each Wednesday this article will be updated with the current seasonal study using CQG's Seasonal analysis applied to the Soybean, Wheat and Corn markets. You can download the CQG pac providing the… more
Adam Rozencwajg: Currently, a Managing Partner of Goehring & Rozencwajg, Natural Resource Investors. Adam has many years of investment experience. Between 2007 and 2015, he worked exclusively… more
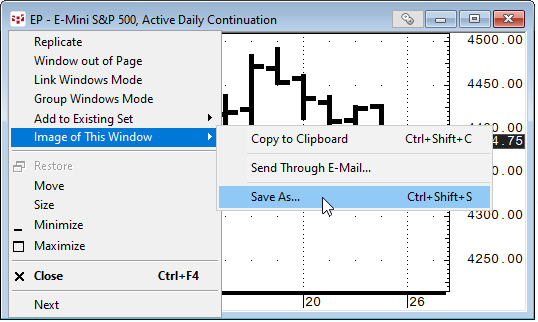
If you are an analyst, blogger, or simply want to post a screen capture of an IC or QTrader chart on social media then the steps to copying a screen capture to your clipboard are very easy.
… more

A giant hello and salutations from Notes From Underground.
It has been quite a long time since I have sat down to write about the state of things, but it is not because I haven’t been… more
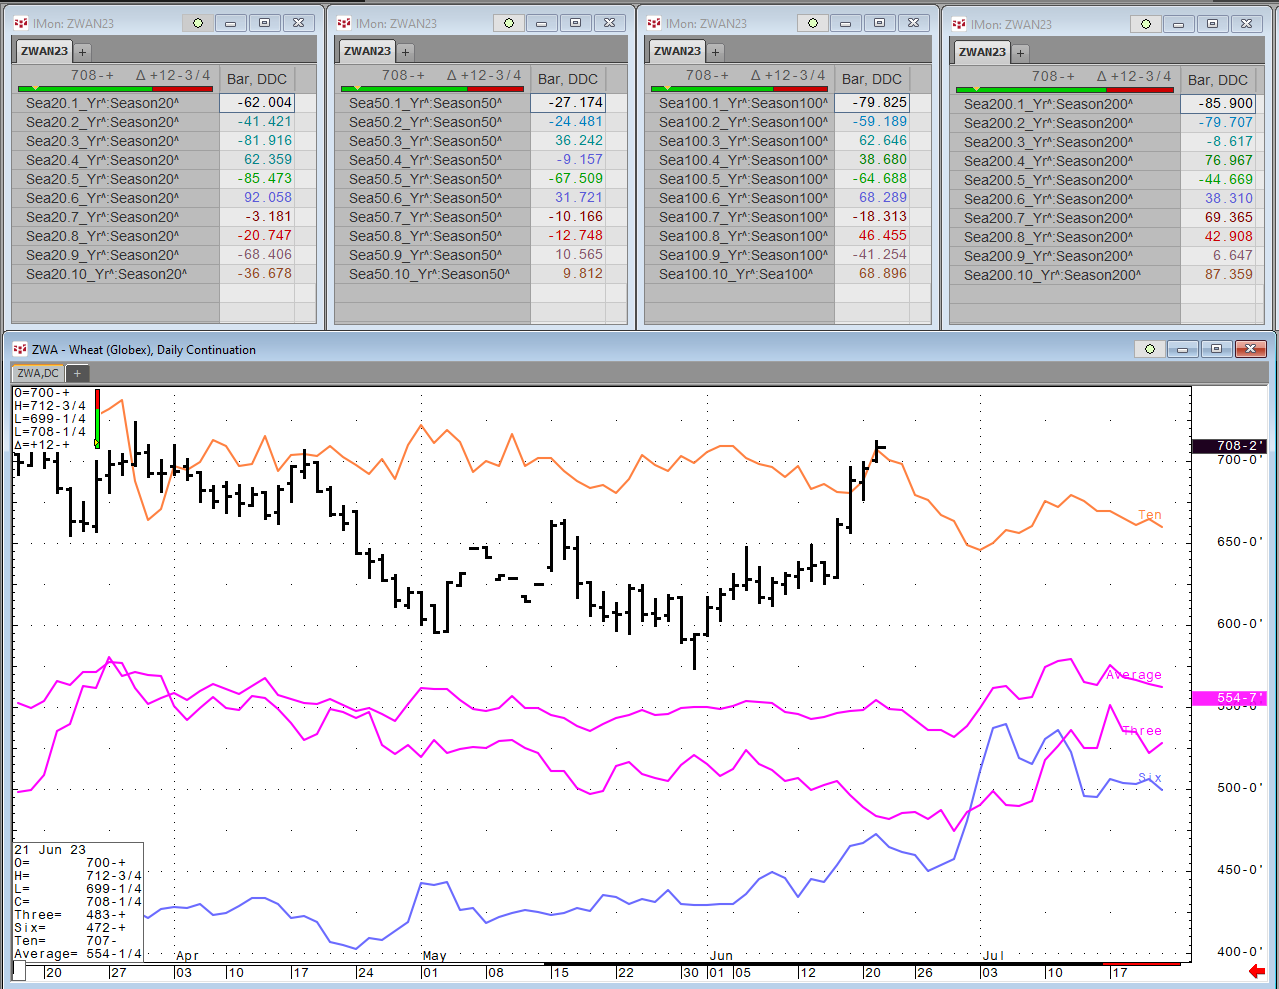
Each Wednesday this article will be updated with the current seasonal study using CQG's Seasonal analysis applied to the Soybean, Wheat and Corn markets. You can download the CQG pac providing the… more
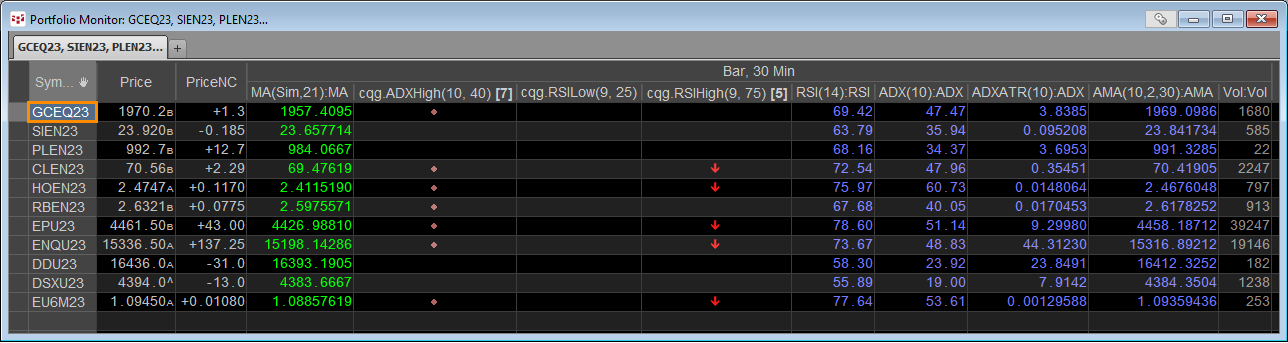
The Portfolio monitor is a combination market quotes and study values display. In addition, the Portfolio monitor can display the status of conditions, such as a study has hit an overbought level… more
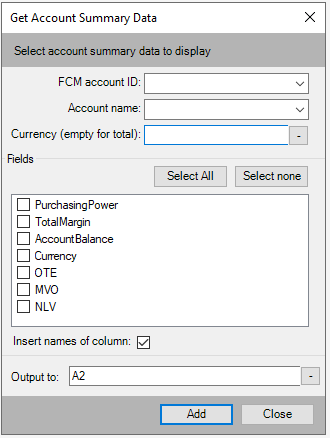
The CQG RTD Toolkit Excel Add-in is installed with CQG IC. The Account Summary dialog has been updated to include a Currency field. Use the currency symbol found on the Orders & Positions… more
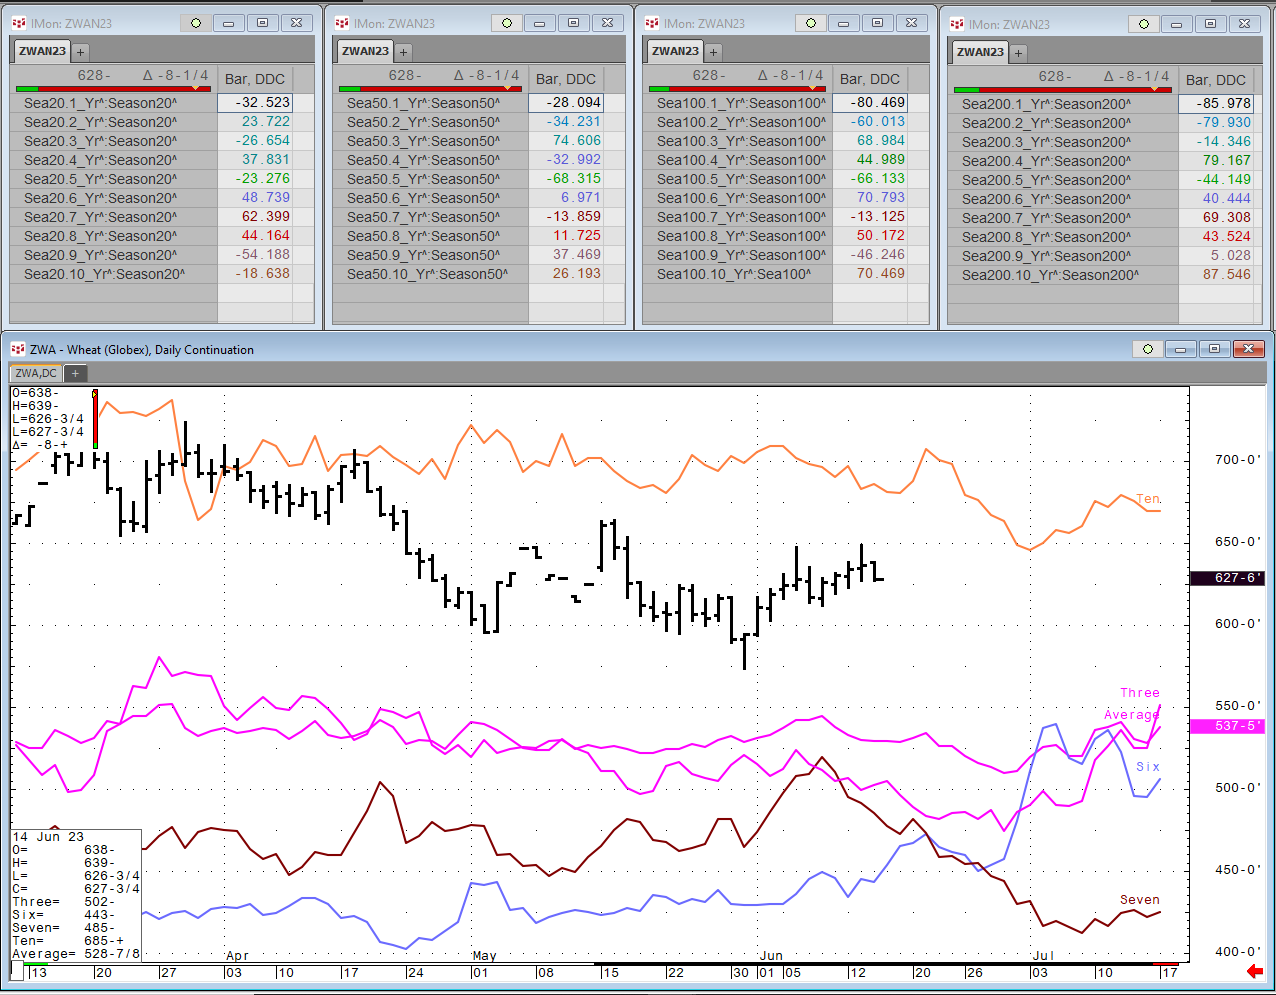
Each Wednesday this article will be updated with the current seasonal study using CQG's Seasonal analysis applied to the Soybean, Wheat and Corn markets. You can download the CQG pac providing the… more