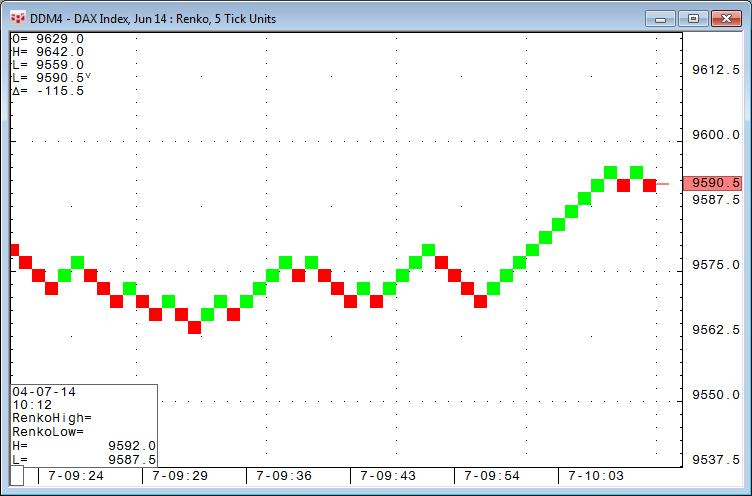
In CQG Integrated Client version of the year, CQG 2014, we have introduced four new chart types: Heikin-Ashi, sub-minute bar, range bar, and Renko. In this article, we will look at… more
Coding
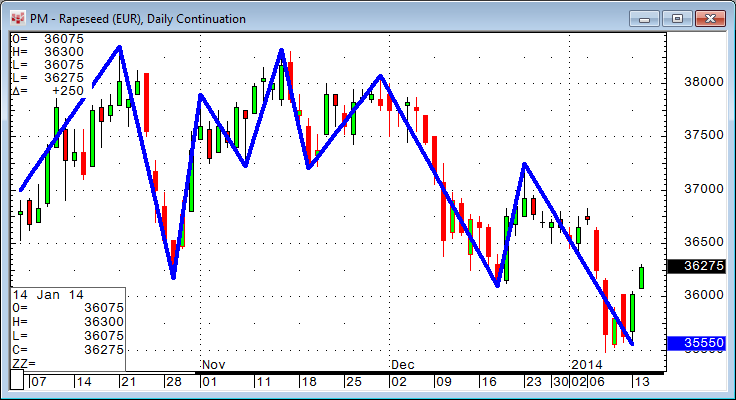
In this article, we measure the price action between a significant high and a significant low identified by CQG's ZigZag study. The ZigZag study is a useful graphical tool that connects… more
Occasionally we receive requests from traders asking how to protect their own formulas from being viewed and modified by someone else. Here is a short guide detailing the steps.
The quick… more
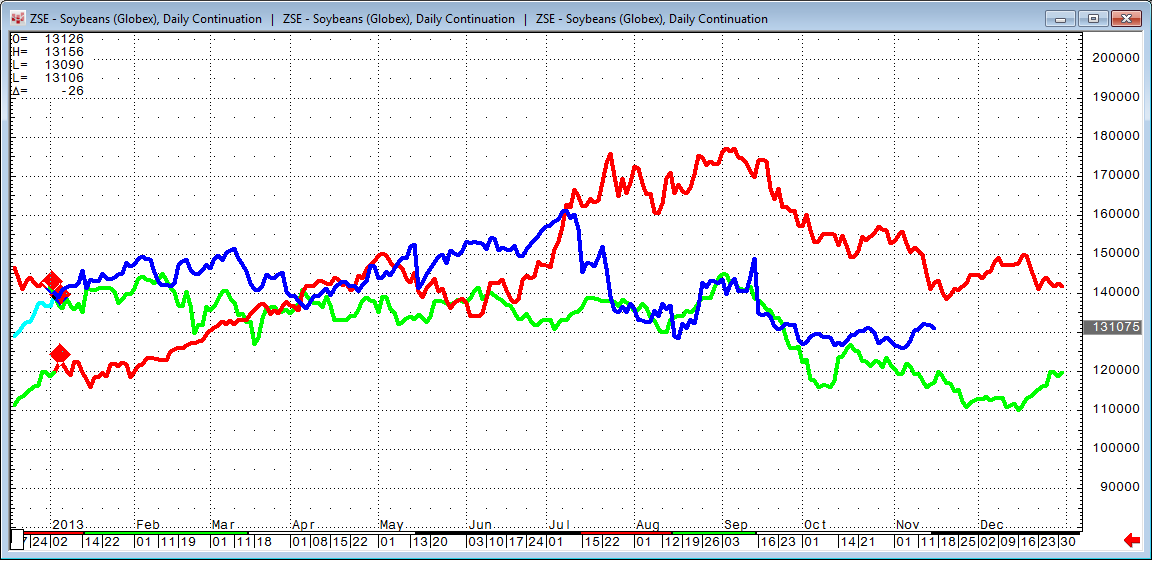
This short article is not a huge programming exercise, it is mainly about a smart way to see seasonal behavior in an overlay chart. Here is the result we would like to have:
The… more
Overview
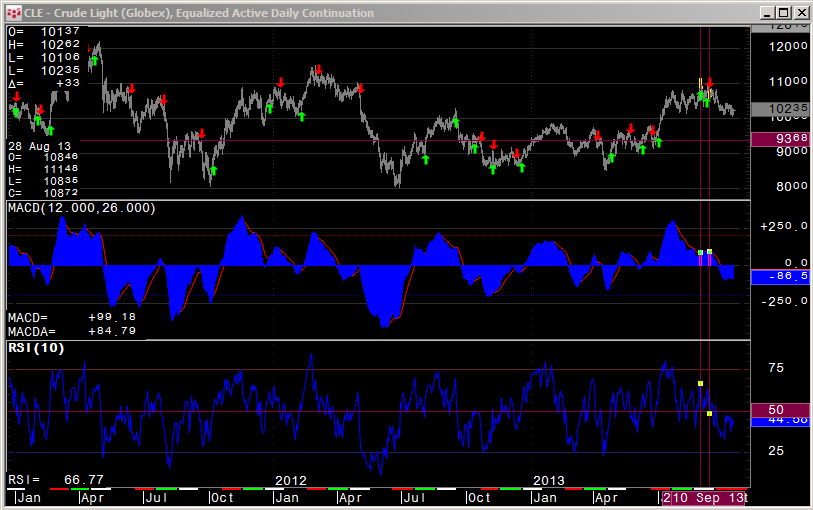
CQG Signal Evaluator (SigEval) allows you to quickly assess the validity of a trading signal before spending valuable time creating fully-fledged trading systems… more
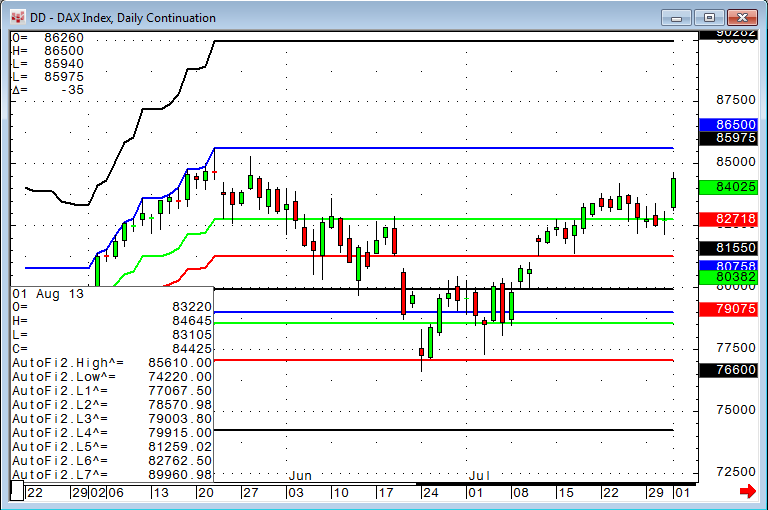
Editor's Note: In this article, Mueller expands on the Auto Fibonacci study concept covered in his August 27 article. Here he shows how to enhance the study by forcing the calculation to use… more
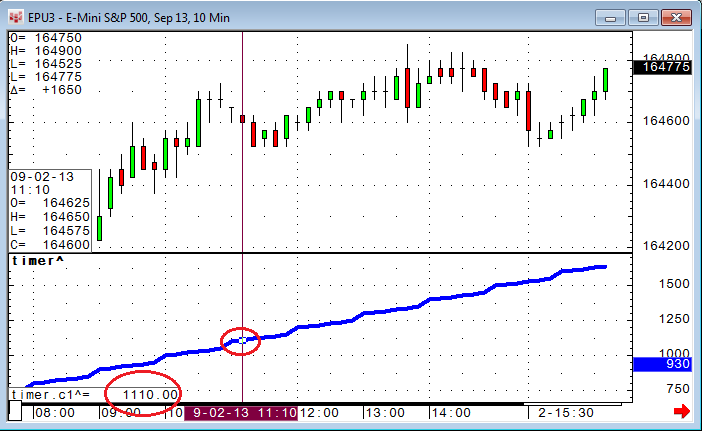
We often receive questions on how to limit trading activity to certain times of day. One little extra line of code can accomplish this quite easily.
In CQG there is a very efficient… more
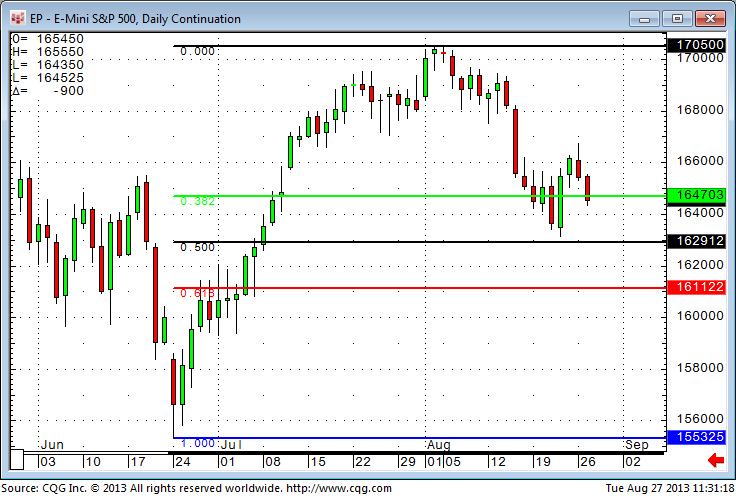
Derived from contributions medieval mathematician Leonardo Fibonacci made to number theory, retracements measure the price areas where a market move is likely to pause or reverse a trend. Many… more
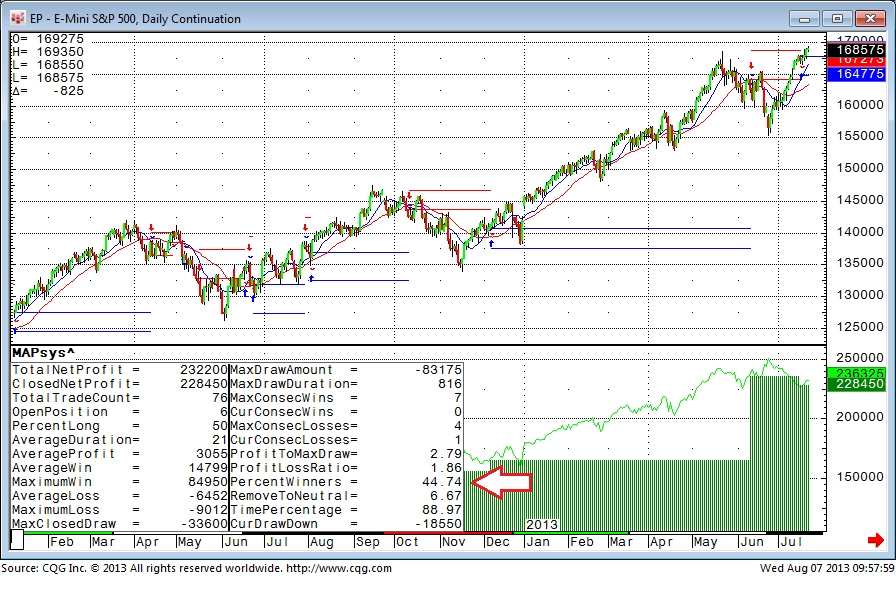
If we look more closely into trend-following trading systems, sometimes the percentage of winning trades is only slightly above 50%, but the trading system still creates some nice and profitable… more