The US economy is the world’s largest. The US dollar has been the world’s most stable currency, and it is universally accepted as the reserve currency around the globe. The dollar is the benchmark pricing mechanism for most commodity prices, and it traditionally has an inverse relationship with raw material prices.
The rise in the dollar commencing in May 2014 when the US dollar index was trading at 78.93 was significant.
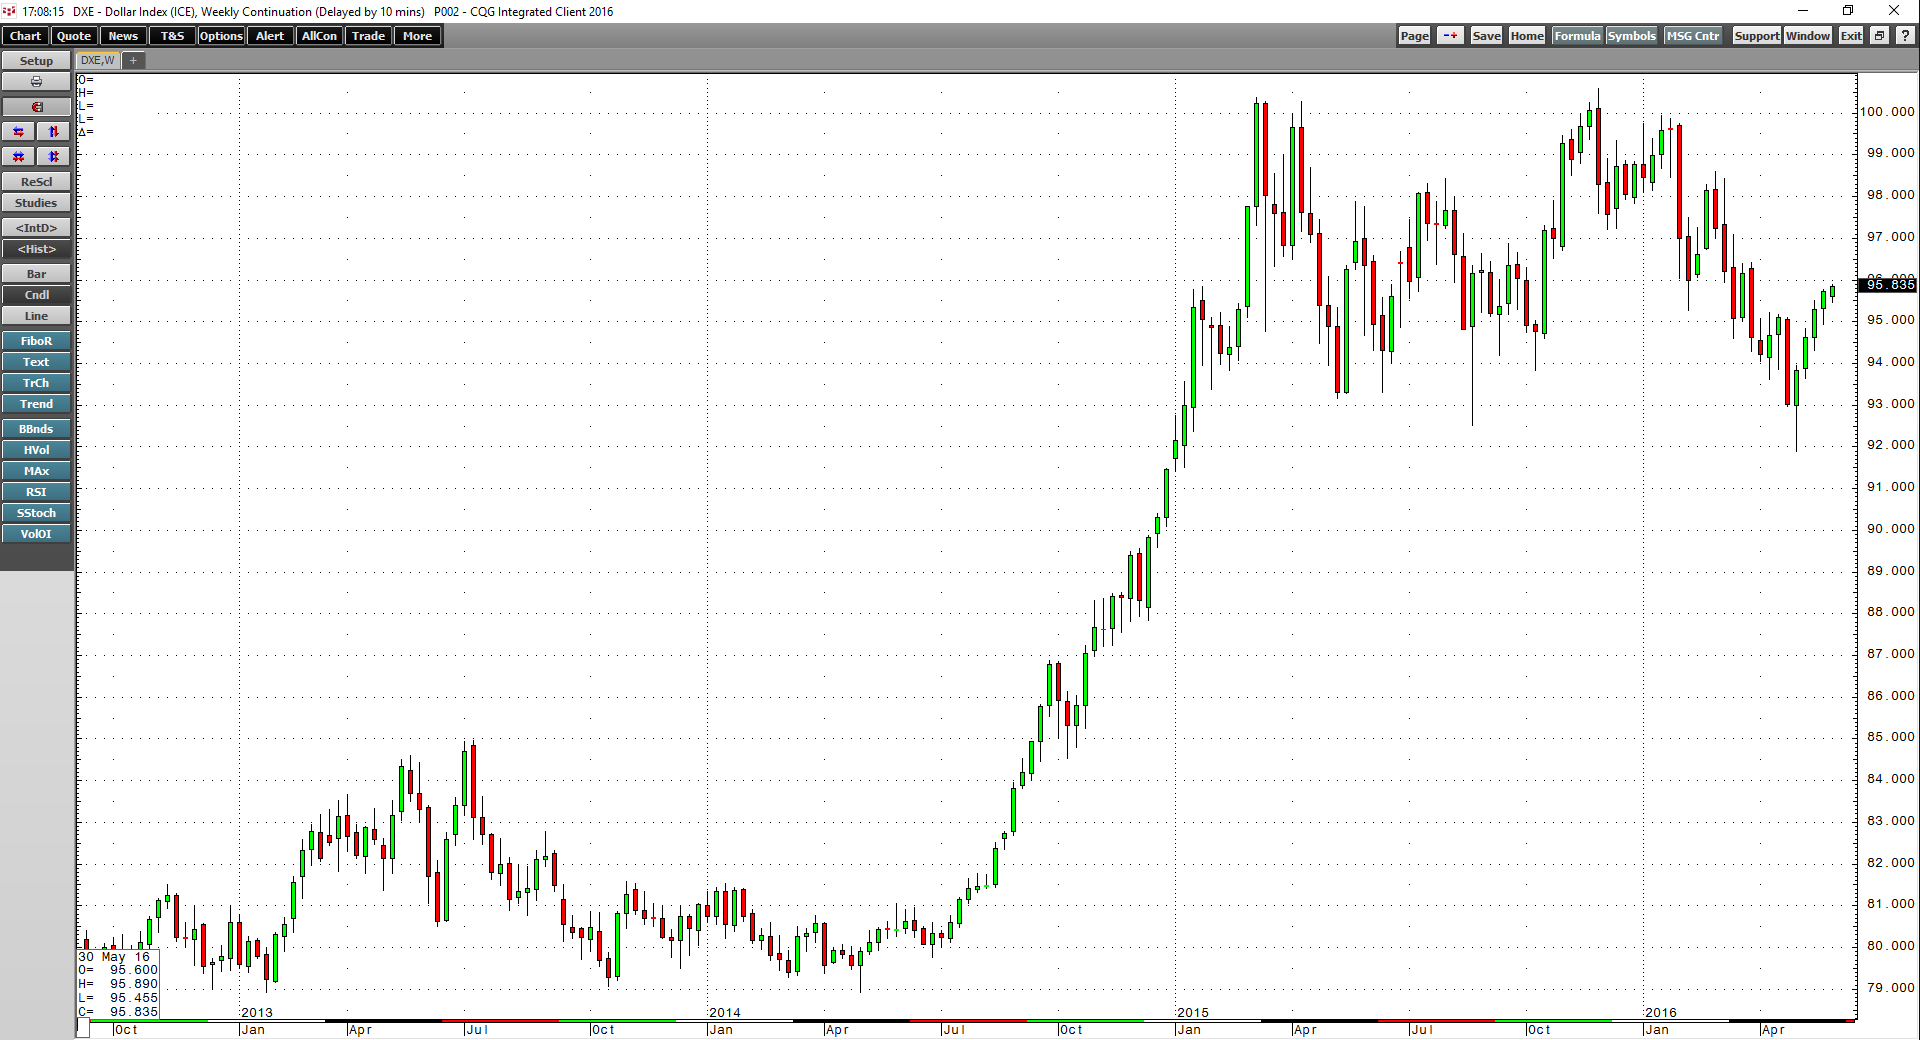
The US dollar index weekly chart highlights that the futures contract rose to 100.38 or over 27% by March 2015. A move of this magnitude in such a short time is unusual for a currency. However, the US economy had been recovering after the plight of the global financial crisis of 2008 while other economies around the globe continued to stagnate. Relative strength in the US economy caused the dollar to appreciate. After years of accommodative monetary policy in the US, markets began to prepare for a tightening cycle, and US interest rates remained above rates in Europe and Japan. The dollar paid more yield than the euro or yen, and it started to look like the divergence in rates would widen.
Commodity prices had been moving lower since making highs in 2011/2012. The rise in the dollar caused downward pressure in many raw material markets to pick up steam. Commodity prices fell to multiyear lows during late 2015 and early 2016 as the dollar remained close to highs. In December 2015, the US Fed hiked interest rates for the first time in nine years and promised markets three to four more rate increases in 2016. Many commodity prices reacted negatively. Crude oil fell to the lowest level since 2003 in February 2016 when it traded to $26.05 per barrel. Copper fell below $2 per pound in early 2016, and many other metals, minerals, and agricultural commodities hit lows.
In 2016, volatility rocked markets from the first trading day of the year. The Fed held off on any interest rate hike, first citing questionable US economic data and later because of the threat of contagion from economic weakness in Europe and Asia. Despite the promise of additional rate increases in 2016, the Fed held off and, as of the end of May, they have yet to raise rates.
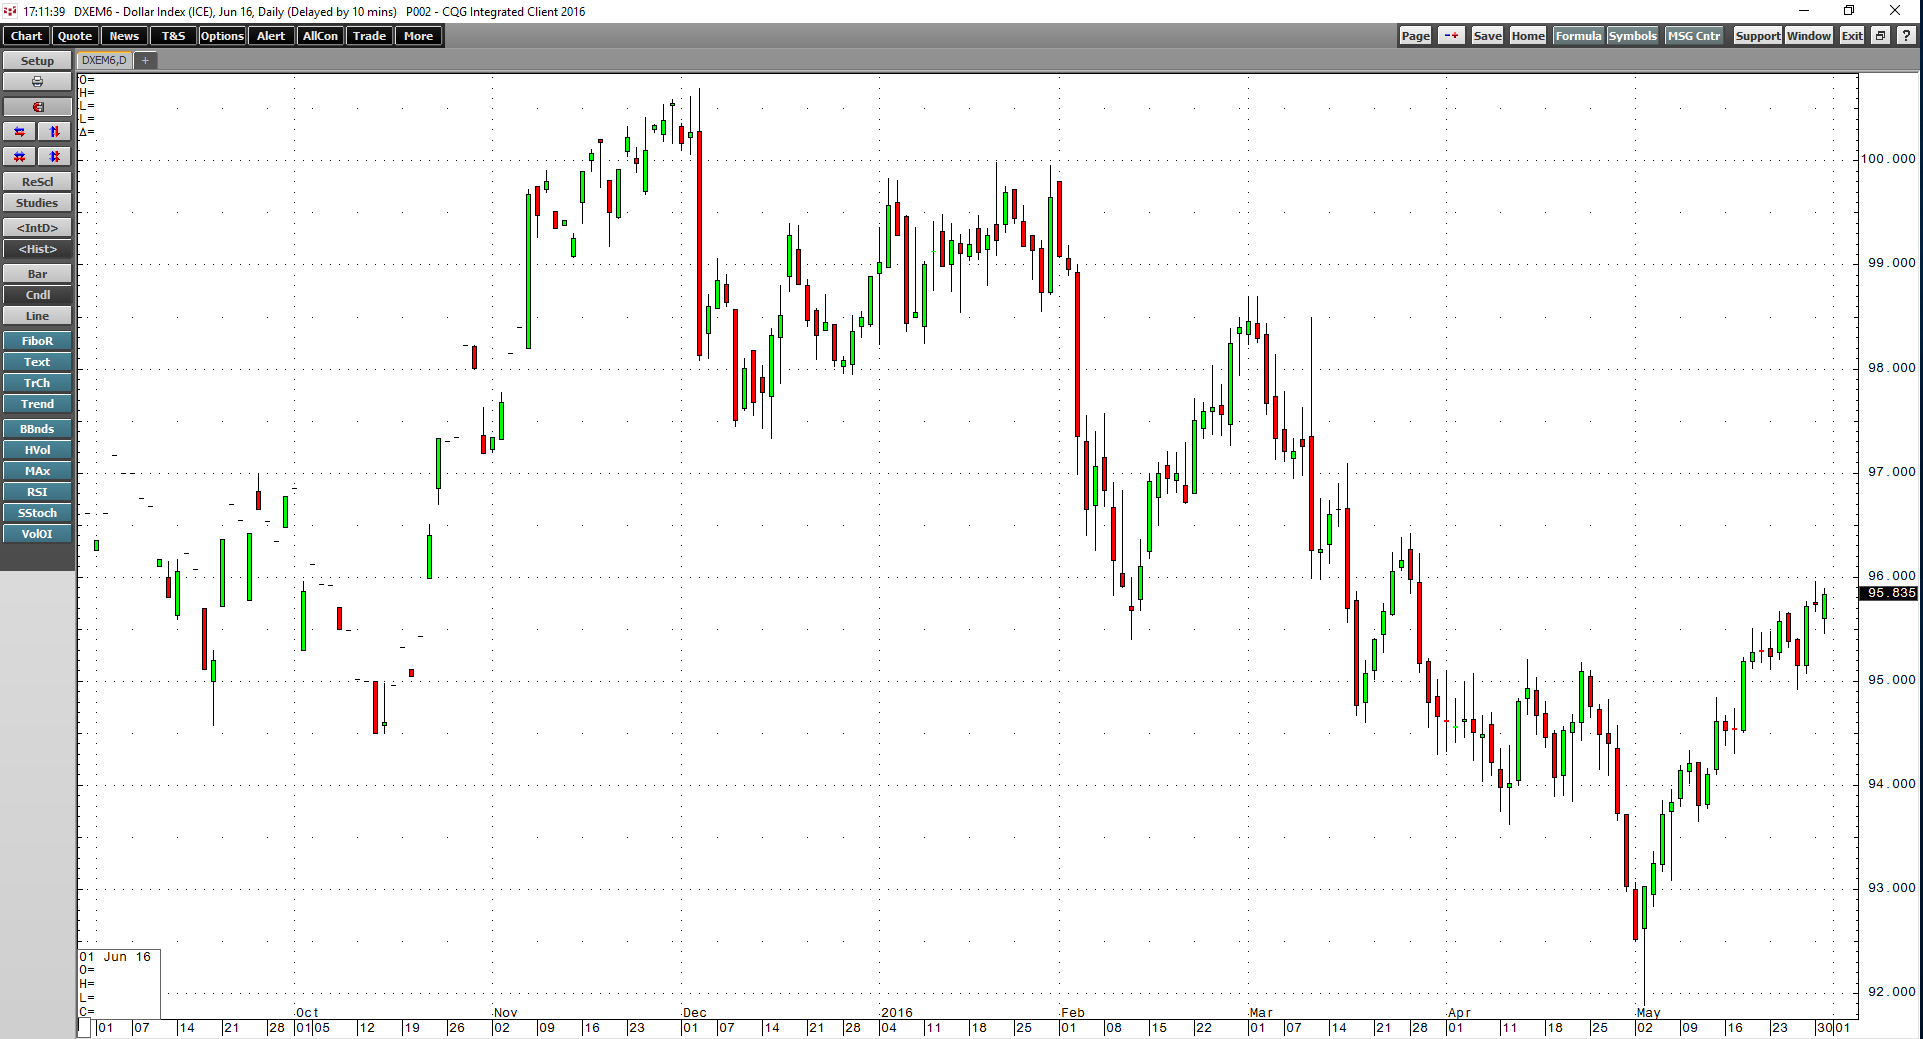
As the daily chart shows, the greenback has made a series of lower highs and lower lows through the first five months of the year. The inverse relationship with commodities and the US currency held and many raw material prices rebounded, some in dramatic fashion. At the end of May, crude oil moved to highs of just above $50 per barrel on the active month NYMEX futures contract – an increase of more than 92% in less than four months. Metals, minerals, and agricultural prices rose as the dollar retreated.
The dollar index hit its nadir on May 3 when it traded to 91.88 on the active month June futures contract. The lows in the dollar corresponded with highs in precious metals markets as gold traded to $1306 and silver to $18.06 per ounce at the same time. However, the dollar bounced on that day and closed the session at 93.03 on the highs of the day. The precious metals moved lower.
On May 18, the US central bank released the minutes of the April FOMC meeting, which pointed to an interest rate increase this summer, perhaps as early as at their June meeting. Markets immediately responded to the Fed message and the dollar followed through on the upside. The strength of the dollar has created a significant technical pattern on the long-term monthly chart that may have severe ramifications for the future path of the dollar, commodity prices, and other asset values over the weeks and months to come.
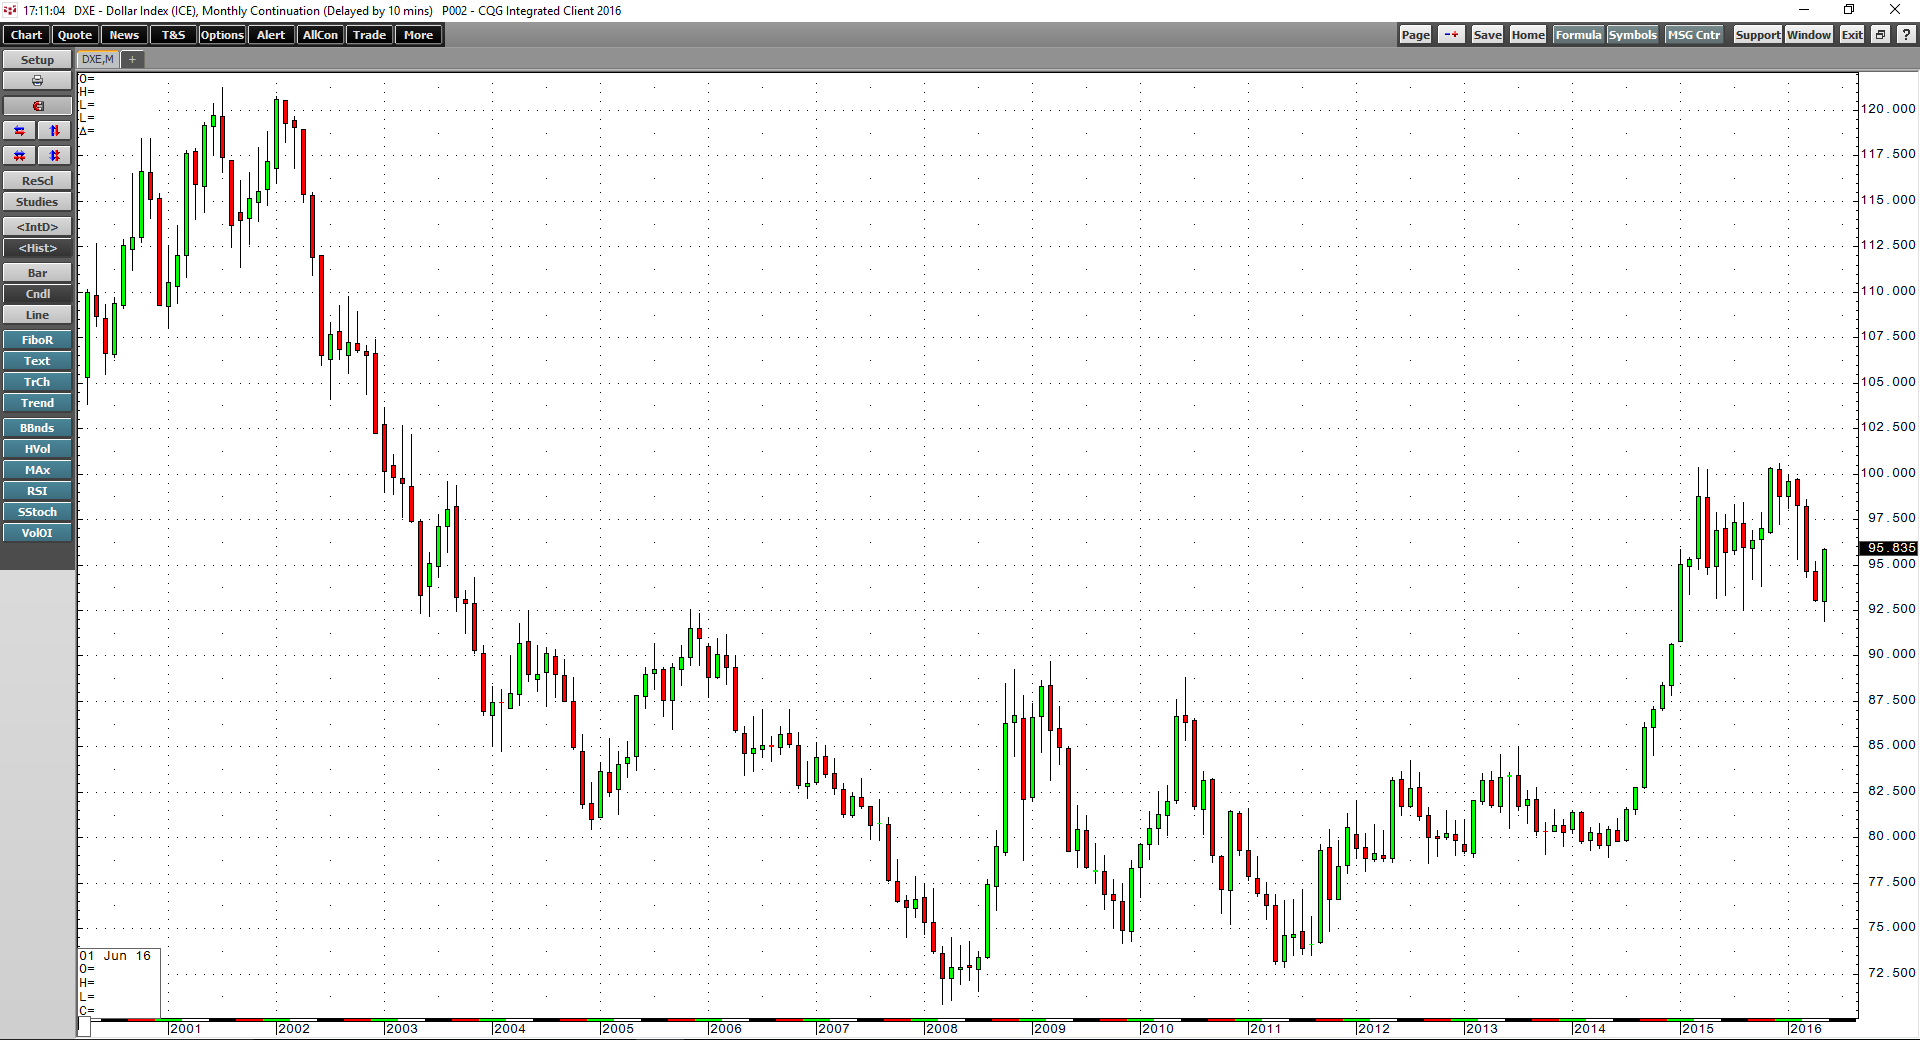
The price action in the US dollar index in May set up a bullish key-reversal trading pattern on the monthly chart in May. A bullish key-reversal trading pattern on a monthly chart occurs when a price trades below the lows of the previous month and closes above the prior month’s highs.
As the monthly chart highlights, the dollar index traded to lows of 91.88 during May; the low in April was 92.975. The high in April was 95.21, below the ending price for the dollar index on Tuesday, May 31, resulting in a bullish technical signal on the long-term monthly chart. The dollar index closed May at 95.878 on the June futures contract.
The last bullish key-reversal trading pattern in the dollar index happened in October 2015 when the index closed at 97.005. The bullish technical signal in the dollar caused a rally to highs of 100.60 by December 2015 – an increase of 3.7% from the October close. Another such technical pattern in the dollar occurred in July 2014. The dollar index closed that month at 81.53 and rallied to 100.38 by March 2015 – an increase of 23% in eight months, the bulk of the recent move for the dollar. Each month between July 2014 and March 2015 the dollar rose in value.
The technical signal for the dollar in May is a highly significant event. It could have severe consequences for commodity prices in the months ahead. A stronger dollar could negatively impact US exports, and it could cause the Fed to have second thoughts about further interest rate increases. A technically-influenced launch of the US currency may have serious ramifications for all other asset classes including stocks, bonds, and commodities. It could be the start of another big leg up for the US currency.