The raw material markets asset class edged higher in the third quarter of 2021 after posting gains in Q1 and Q2. The commodity asset class consisting of 29 of the primary commodities that trade on US and UK exchanges moved 2.11% higher in Q3 than the level at the end of June and was 22.43% above the level for the year that ended on December 31, 2020. In 2020, the asset class moved 9.89% higher. In 2019 it gained 10.98%, but in 2018 the asset class lost 6.82% of its value.
The overall winner of the 29 for the first quarter was the NYMEX natural gas market that posted a gain of 60.74% in Q3 as storms in the Gulf Coast, low US inventories, US energy policy, and shortages in Europe and Asia pushed the price to the highest level since February 2014.
Natural gas had not traded at over the $6 per MMBtu level in September since 2008. Oat futures came in second place with a 51.63% gain as dry conditions boosted the grain’s price. Cotton, a soft commodity, was the third-leading market, posting a 25.91% price increase since June 30, 2021, as the price moved over the $1 level for the first time since 2011. The biggest loser in the composite for the quarter was the palladium market which fell 31.64% after the price rose to a record high at over $3000 per ounce in May. Corn futures was the second worst-performing commodity with a 25.45% loss in Q3. Ethanol fell 22.58% over the third quarter of 2021.
Coal for delivery in Rotterdam, the Netherlands, rose 101.24% as a shortage in the fossil fuel gripped the world. The Baltic Dry Index gained over 46.6% as higher energy prices, container shortages, bottlenecks in the supply chain, and dry bulk commodity demand soared. Iron ore and rhodium prices plunged 44.23% and 32.03%, respectively, after making highs earlier in 2021.
There were lots of double-digit percentage gains in Q3. Three markets were over 50% higher, four gained from 20% 49% percent, and six were from 10% to 19% higher. Twelve markets posted double-digit percentage losses during the quarter. Losers edged out winners in the third quarter of 2021 by a margin of 21 to 20.
Over the first nine months of 2021, 32 commodities posted gains, while nine moved lower from the price level on December 31, 2020.
The US dollar is typically a significant factor for commodity prices, as it tends to have an inverse value relationship with raw material prices. The dollar index rose 1.96% in Q3, pushing the index 4.83% higher over the first nine months of 2021. The dollar index was 0.34% higher in 2019 after moving 4.26% higher in 2018, which followed a 10.23% decline in 2017. The dollar rallied in Q3 on the back of the prospects for higher US interest rates. US 30-Year Treasury bond futures fell 0.86% in Q3 and was 7.89% lower since the end of 2020.
Four of six sectors of the commodity asset class rally in Q3
Soft commodities led on the upside in Q3 as the sector gained 17.43%. Over the first nine months of 2021, energy commodities gained 64.07% after an 8.76% rise in Q3, making it the second-best performing sector. Grains posted a 4.99% gain in Q3, on the back of a better than 50% increase in the oat futures market.
Base metals moved 2.08% higher in the third quarter as gains in tin, aluminum, and zinc offset losses in lead and copper. Base metals were 26.53% higher from January through the end of September. Animal proteins moved 5.95% lower in Q3 but moved 14.99% since the end of 2020 as of September 30, 2021. The meats fell as the 2021 peak grilling season ended in early September.
Precious metals were the worst-performing sector of the asset class, with a 14.61% loss in the third quarter and a 14.34% decline through the first nine months of 2021. The rising dollar and prospects for higher interest rates sent silver and gold lower. Supply chain bottlenecks affecting semiconductors and automobile manufacturing weighed on platinum group metals as demand declined. Platinum, palladium, and rhodium prices suffered double-digit percentage losses.
Four of six sectors of the commodities asset class rallied in Q3. Five of six moved higher over the first three quarters of 2021, with precious metals the only losing sector this year.
Winners in Q3 and over the first nine months of 2021
Twenty commodity markets moved higher in Q3 2021.

The overall trend in the asset class remained bullish after moving higher each quarter starting in Q2 2020. Through the first nine months of 2021, the following 32 commodities posted gains:

Meanwhile, the stock market made new highs in Q3 but ended on a mixed note. The DJIA was 1.91% lower, the S&P 500 edged 0.23% higher, while the NASDAQ drifted 0.38% to the downside. All three posted double-digit percentage gains in the first nine months of 2021 but ended Q3 on a weak note.
Meanwhile, Bitcoin, Ethereum, and digital currencies experienced parabolic rallies in Q1 and Q2, taking prices to all-time highs and the market cap to over the $2.4 trillion level before the parabolic move imploded and the two leading cryptocurrencies halved in value from the April and May 2021 highs. In Q3, the leading cryptos and overall market cap moved higher. Bitcoin was 24.67% higher in Q3 and 49.71% higher since the end of 2020. Ethereum gained 32.41% in Q3 and was 304.12% higher than the closing price on December 31, 2020, on September 30. The market cap at the $1.925 trillion level was 33.03% higher on a quarter-by-quarter basis. The overall value moved 150.82% higher over the first nine months of 2021. Bitcoin underperformed while Ethereum outperformed the asset class as market participants view Ethereum as a faster and more efficient blockchain with more utility.
Losers in Q3 and over the first nine months of 2021
Twenty-one markets moved lower in Q3.
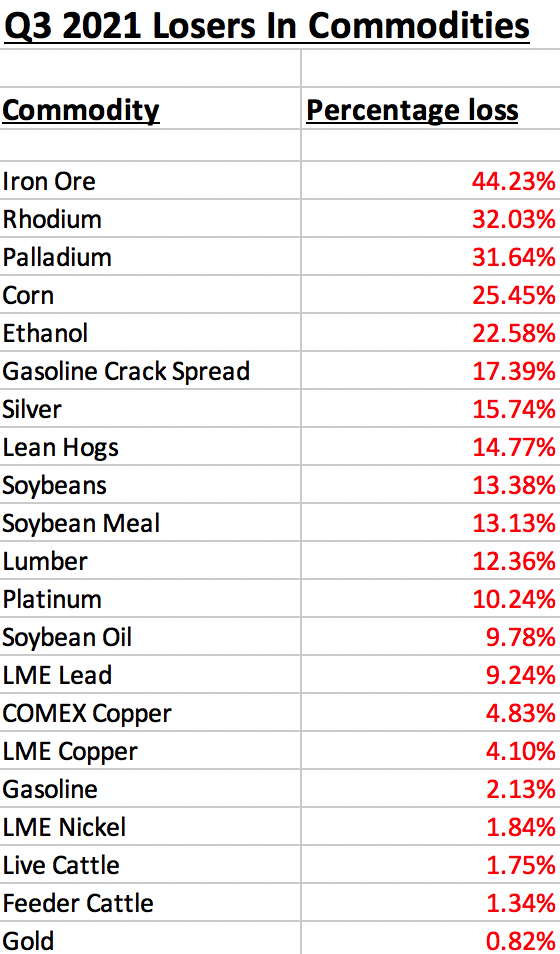
Twelve commodities lost over 10%. Losers edged out winners in Q3.

Over the first nine months of the year, winners outnumbered losers by a 3.56:1 margin as the bull continued to charge higher in the commodities asset class.
The rally in commodities has been nothing short of a bullish relay race to higher prices, with one raw material market handing the bullish baton to another. In Q3, the soft commodities sector took the baton as it posted the most significant sector gain.
Highlight on soft commodities
All five of the soft commodities posted double-digit percentage gains in Q3. Cotton led the way on the upside.
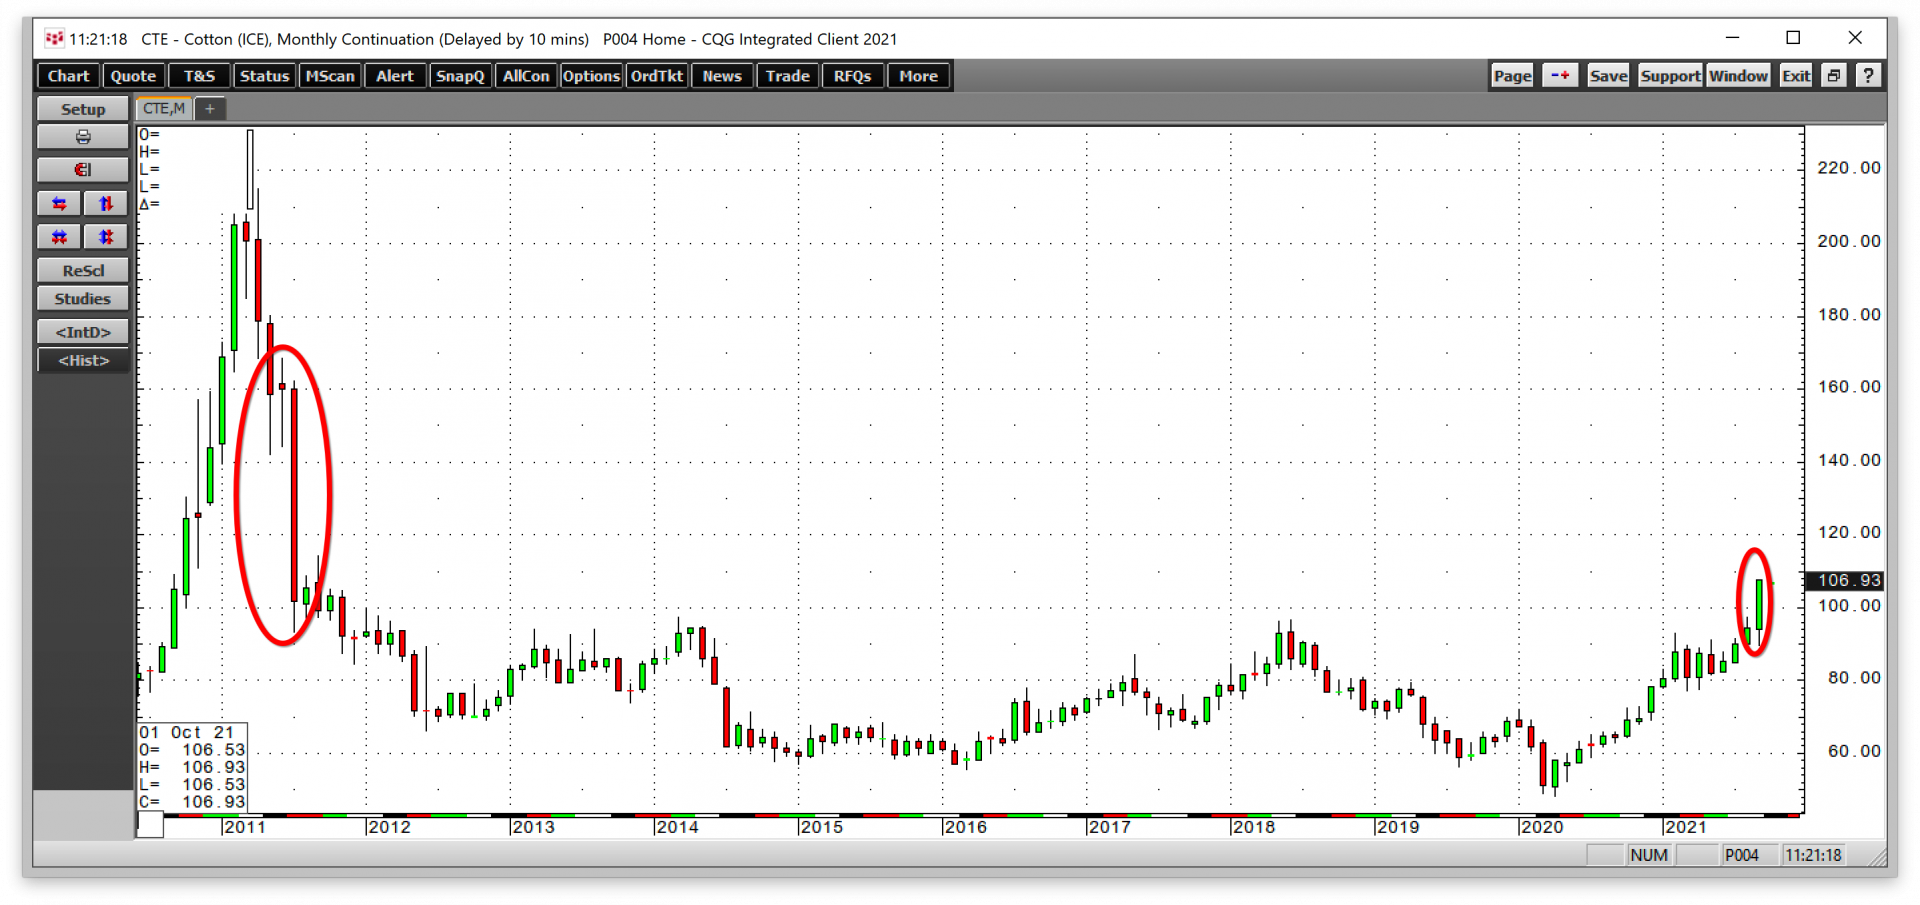
ICE cotton futures rose 25.91% in Q3 and was 35.43% higher over the first three quarters of 2021. Cotton rose above $1 per pound at the end of Q3, the highest price in a decade since 2011.

ICE coffee futures rose to a high of $2.1520 per pound in July before pulling back at closing with a 21.74% gain in Q3 and a 51.27% increase since the end of 2020. Coffee rose to the highest price since October 2014 in July.

ICE sugar futures gained 15.37% in Q3 and 31.31% over the first nine months of 2021. Nearby sugar futures eclipsed the 20 cents per pound level for the first time since early 2017.

ICE cocoa futures were 12.37% higher in Q3 but only edged 1.88% higher since the end of 2020. Cocoa turned a loss into a gain for the year in Q3. In early Q4, cocoa futures moved to a new high for 2021.

ICE frozen concentrated orange juice futures were 11.77% higher in Q3 and 7.51% higher over the first nine months of 2021. FCOJ reached the highest price since 2018 when the continuous contract traded to $1.48 per pound in September.
A frost in Brazil pushed the prices of coffee, sugar, and oranges to multi-year highs. Issues with the global supply chain lifted all soft commodities, which carried the bullish torch in the asset class in Q3 2021.
Transitory or not transitory - That is the question
As we head into Q4, the US Fed continues to view rising commodity prices as “transitory.” However, the trend is always your best friend in markets, and at least three factors tell us that inflation may be a lot more than a temporary issue.
- The tidal wave of central bank liquidity and tsunami of government spending is bearish for the value of fiat currencies. Even if the Fed shifts to a more hawkish approach to monetary policy, government stimulus will continue at an unprecedented pace.
- US energy policy to address climate change is causing shortages of traditional energy products. While renewable energy is the future, fossil fuels continue to power the world. Oil, natural gas, and coal are critical inputs and logistical considerations in commodity production and transportation worldwide. Rising input prices put upward pressure on all commodity prices as the cost of goods sold increases.
- The trend is always your best friend in all markets. The bullish relay race in commodities continued in Q3, with soft commodities and energy leading the way. Coal, LME tin, and oats traded to a new all-time high; natural gas, aluminum, coffee, sugar, cotton, and FCOJ reached multi-year highs.
The unforeseen events that occur always tend to move markets the most. No one saw the worst pandemic in a century coming at the end of 2019. The next issue that shocks the markets will likely appear out of the blue. In Q3, the US’s hasty departure from Afghanistan may impact policy decisions in Beijing, Moscow, Teheran, and Pyongyang. Markets reflect the political and economic landscapes. Many issues face markets as we move into the final months of 2021.
Fasten your seatbelts for a bumpy ride. Commodities rose by over 22.4% over the first nine months of 2021, and the overall bullish trend remains intact as we head into Q4.