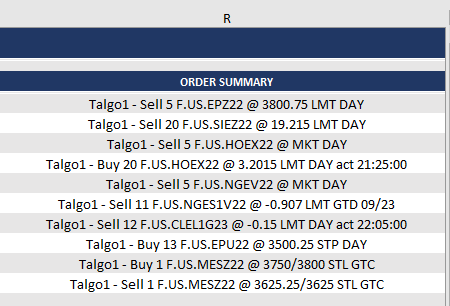
Here, we introduce placing Batch Orders using the CQG XL Toolkit. At the bottom of the post is a downloadable Excel sample. For more details there are two links to the CQG IC/QTrader Help files… more
Excel/RTD
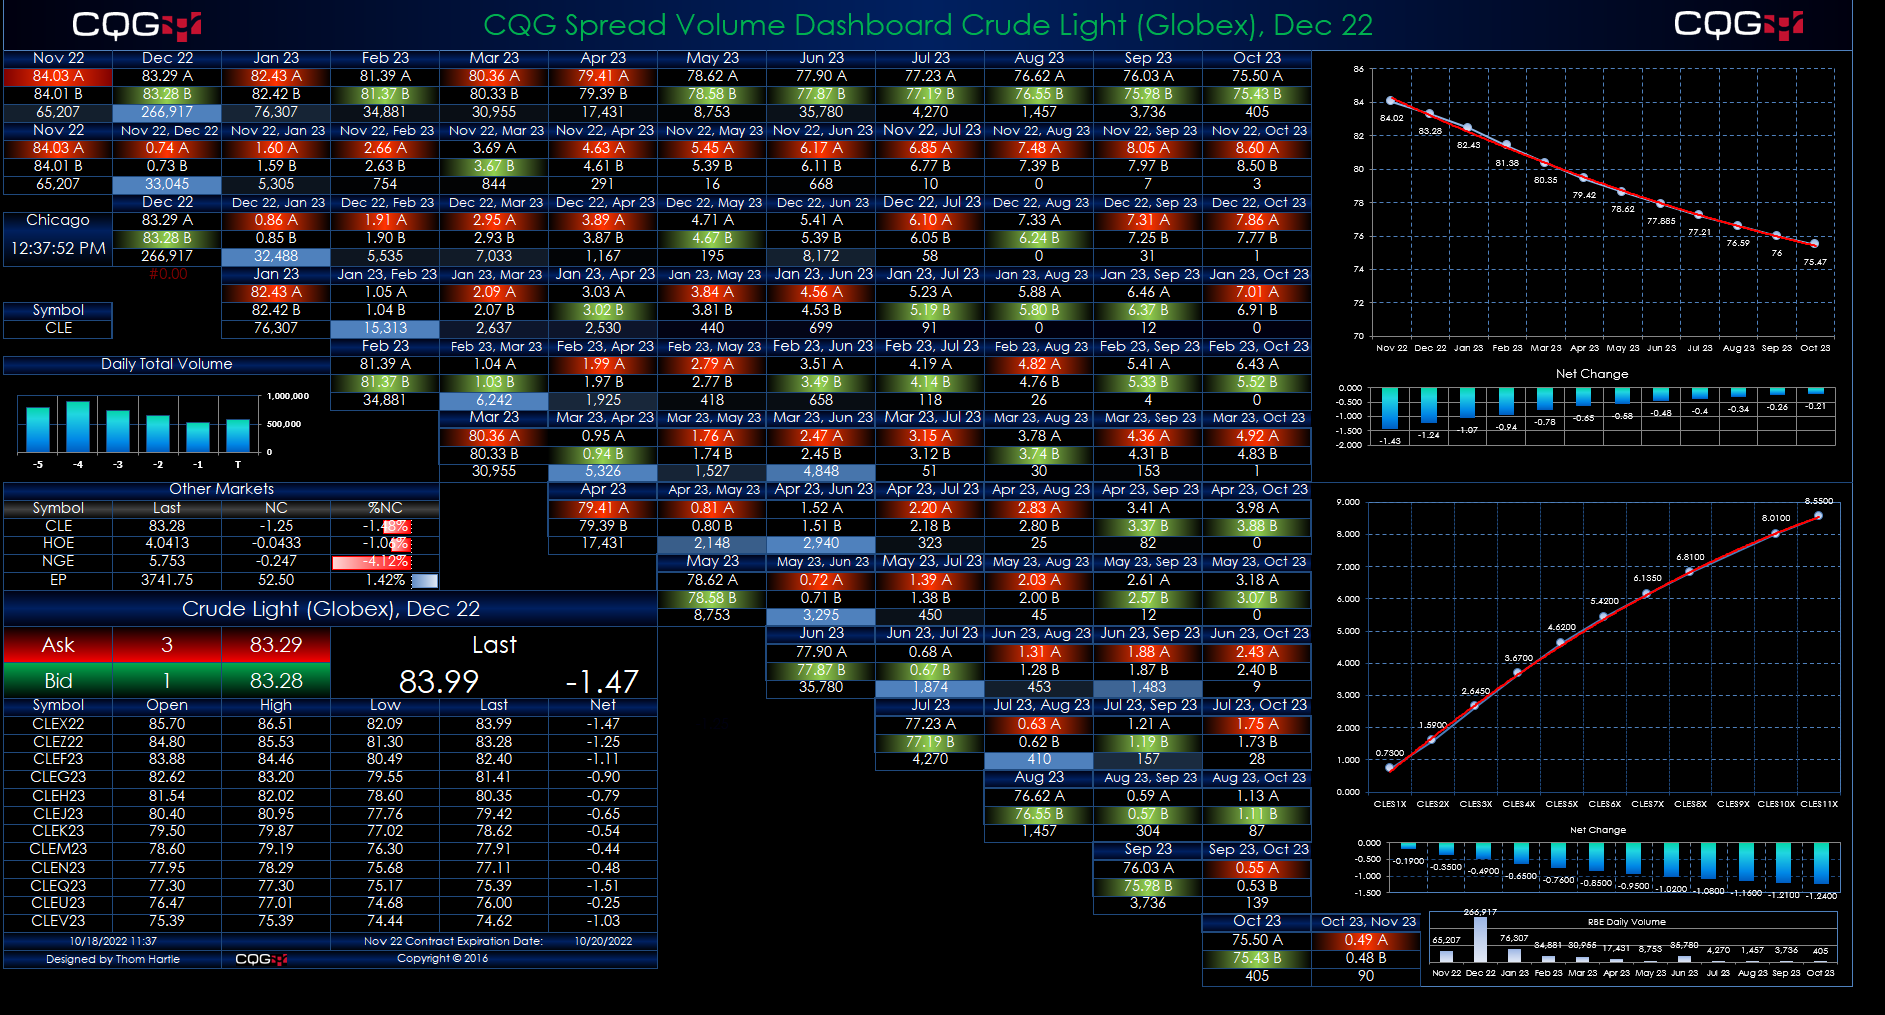
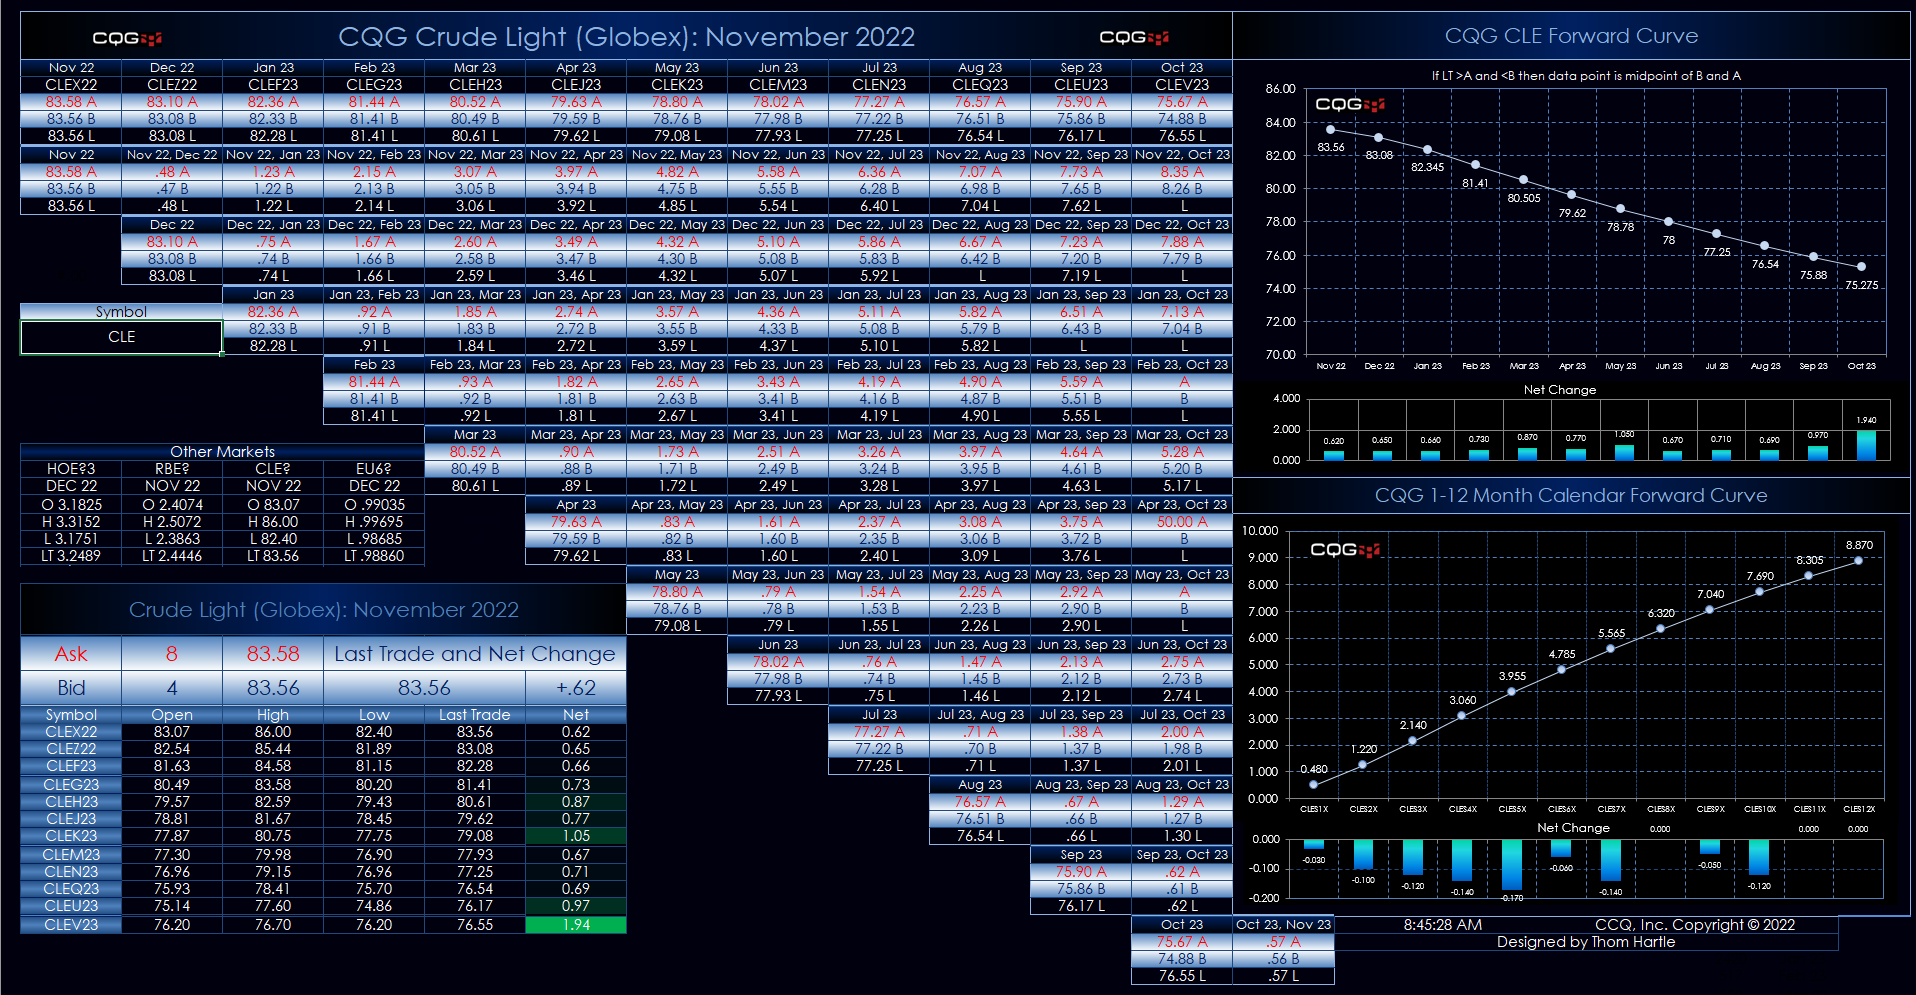
This Microsoft Excel® dashboard displays exchange traded spread market data for a user input symbol. The Excel dashboard uses the CQG RTD Toolkit Add-in, which is installed with CQG IC or CQG… more
This Microsoft Excel® spreadsheet uses the CQG XL Toolkit to pull in market data based on the symbol entered by the user. The XL Toolkit requires the customer’s FCM enable it. The data is pulled… more
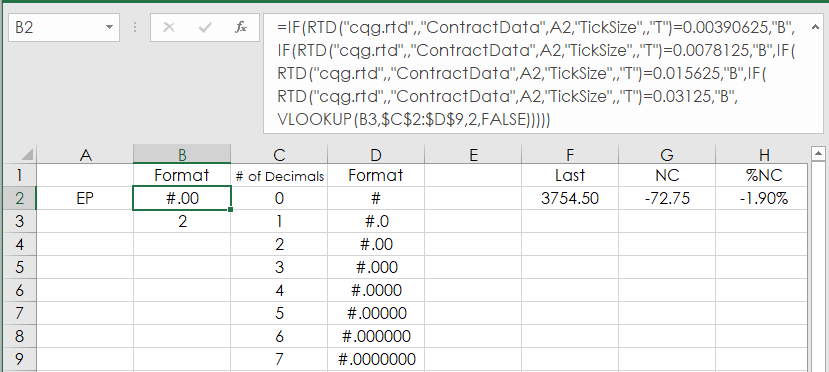
When using RTD functions in Excel to pull in market prices you have to manually format the prices. Excel does not know that the E-mini S&P 500 price has two decimals places (i.e. 3909.25) and… more
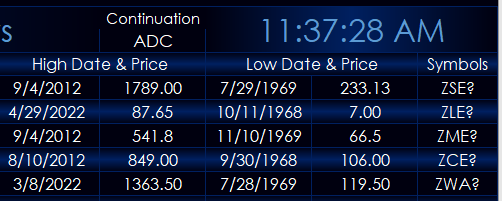
This post details a custom CQG study for pulling a market’s all time high price and date and the market’s all time low price and date.
The custom study was built by CQG’s Product Specialist… more
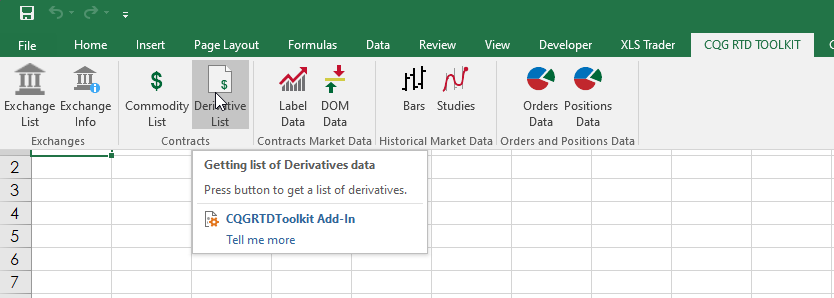
The CQG RTD Toolkit is an Excel Add-in installed with CQG IC and QTrader. This post details how to pull contract information: specifically the First Notice Date and the Expiration Date for a list… more
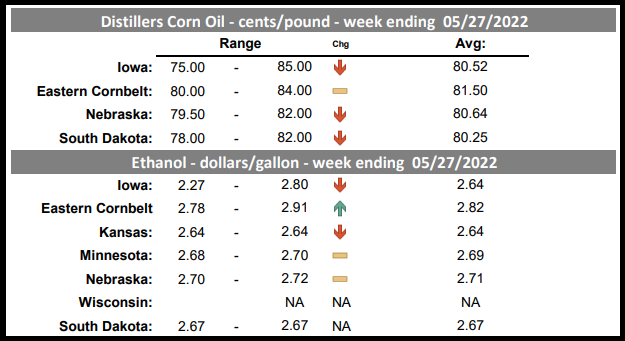
The CQG Data Quality Team has added the USDA Daily Ethanol Report found under USDA in the CQG Symbol Finder. Thirty-four new symbols are available. At the bottom of the post is a CQG PAC that… more
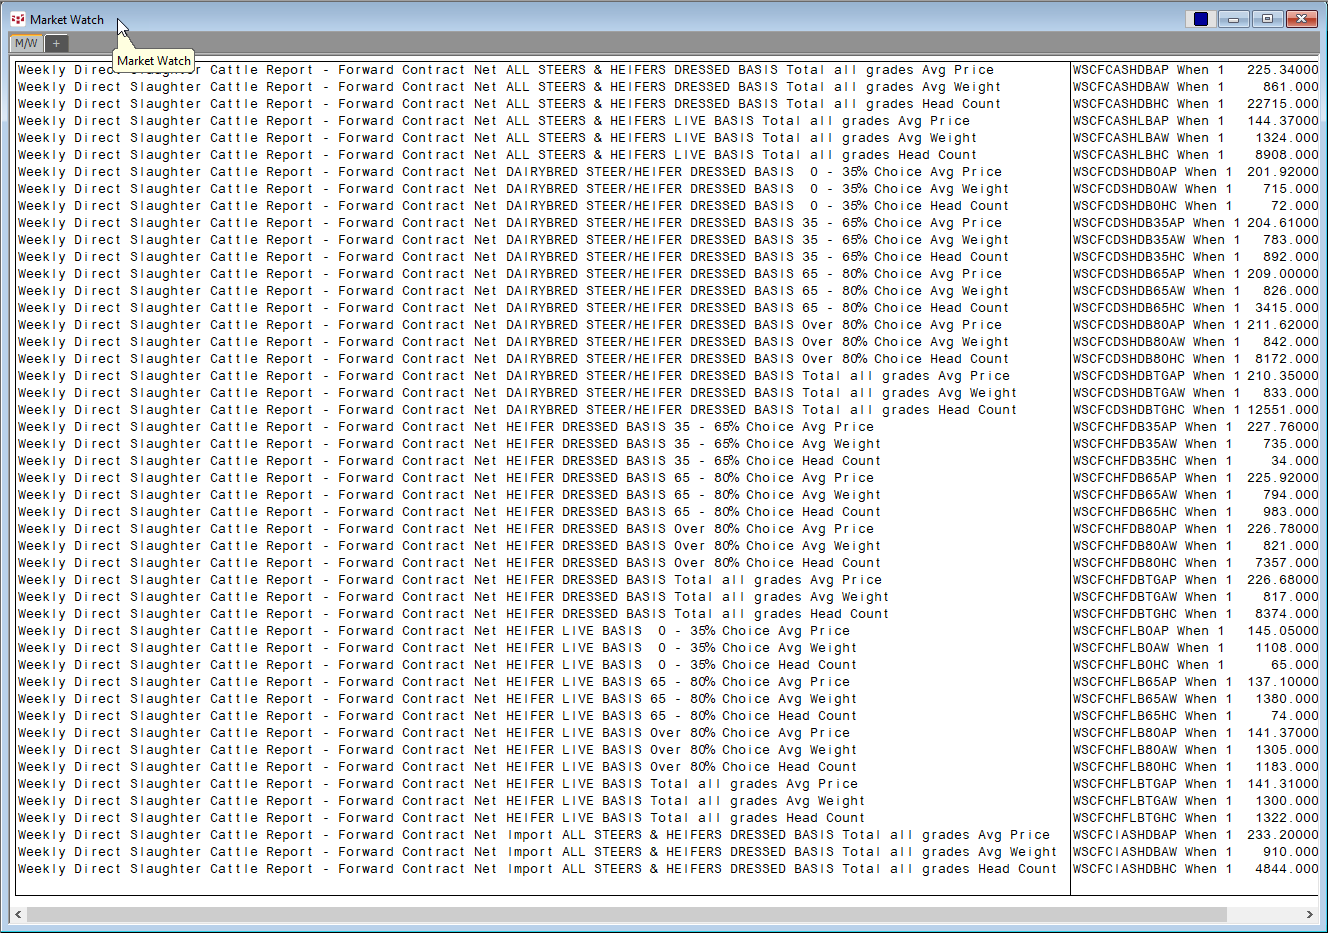
The CQG Data Quality Team has added over 1,000 USDA Cattle Market reports. The symbols are found under the USDA-WASDE group in the CQG Symbol Finder when searching for Cattle.
In… more
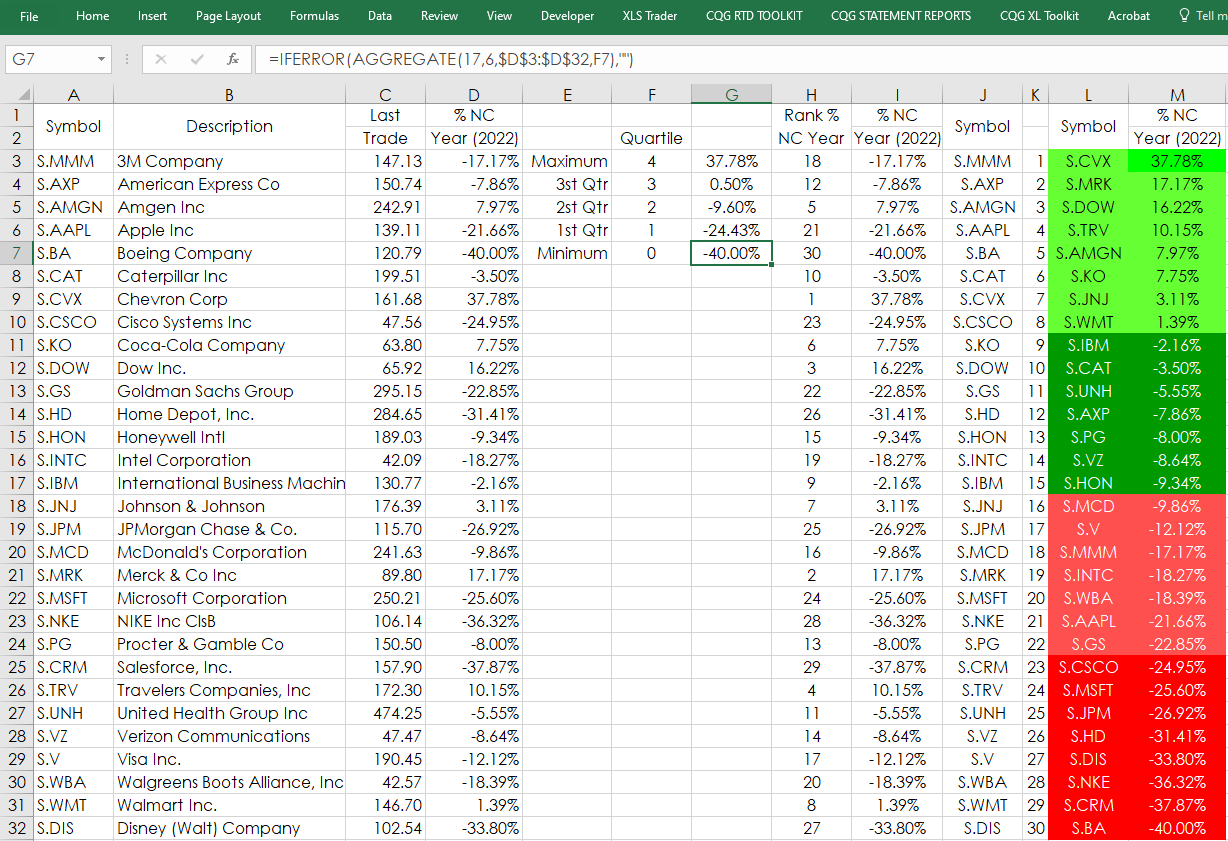
The Excel AGGREGATE function returns an aggregate calculation such as AVERAGE, COUNT, COUNTA, MAX, MIN, PRODUCT, etc., applied to a list of data while optionally ignoring hidden rows and errors.… more
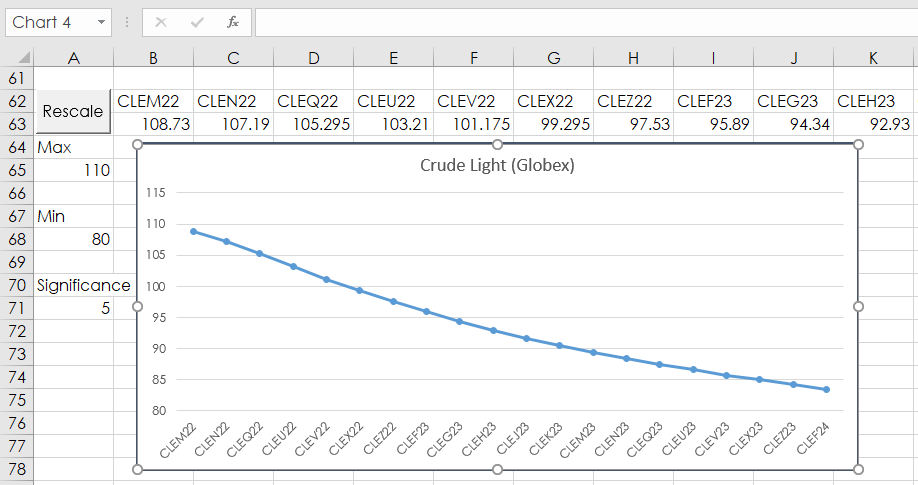
Monitoring market data in Excel may be enhanced by including Forward Curve charts. However, there are issues with Excel charting and the purpose of this post is to offer solutions using Excel… more