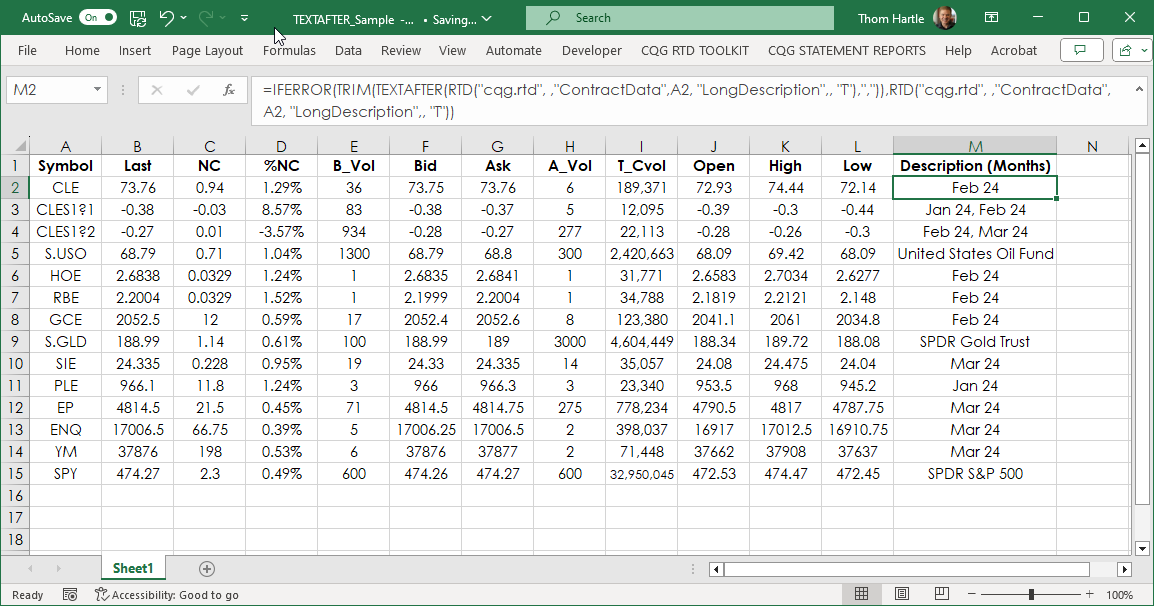
Microsoft® Excel 365 includes a Text function that makes pulling text out of a string much easier than before Excel 365 was released. To illustrate, we will review the steps before Excel 365 was… more
Excel/RTD
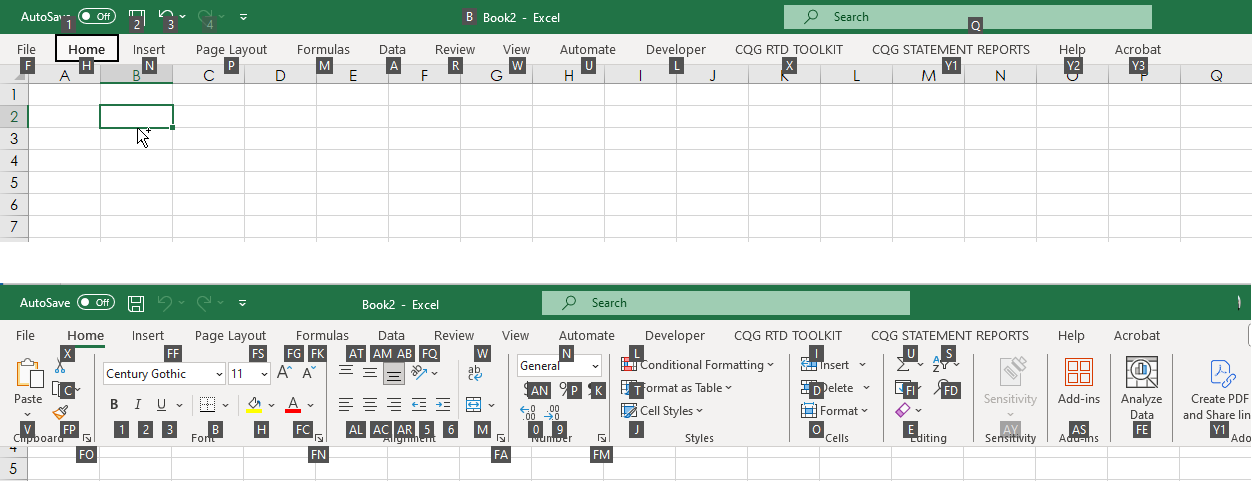
If you use Microsoft® Excel as part of your workflow with CQG IC or QTrader then you may or may not be using Excel keyboard shortcuts. This post details using keyboard shortcuts in Excel 365 to… more
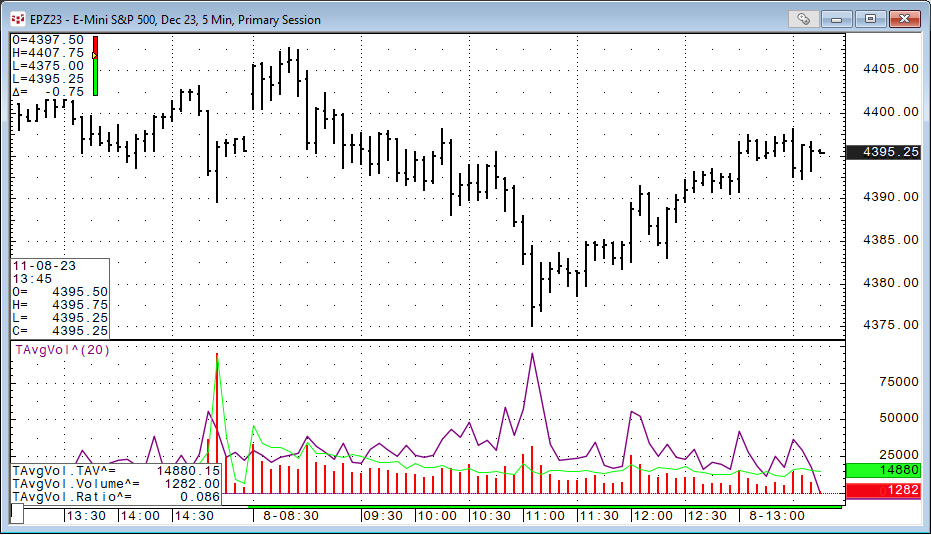
This post details the use of the CQG function: Time Average (TimeAvg), which calculates the average for values taken at the same time of day over the lookback period.
In this example, the… more
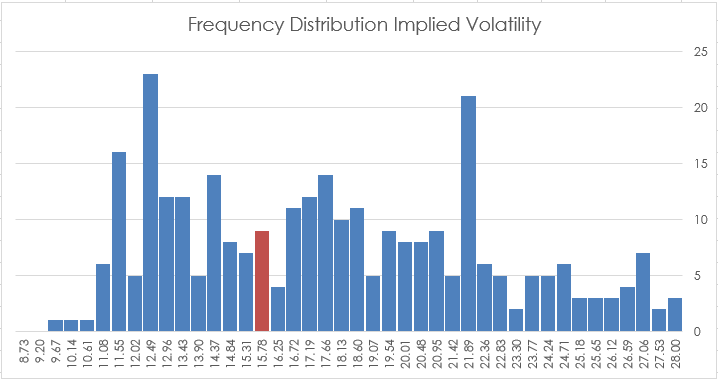
CQG IC and QTrader offer two studies that track volatility: Implied Volatility and Historical Volatility. This post details each study and provides an Excel spreadsheet for tracking the two.
… more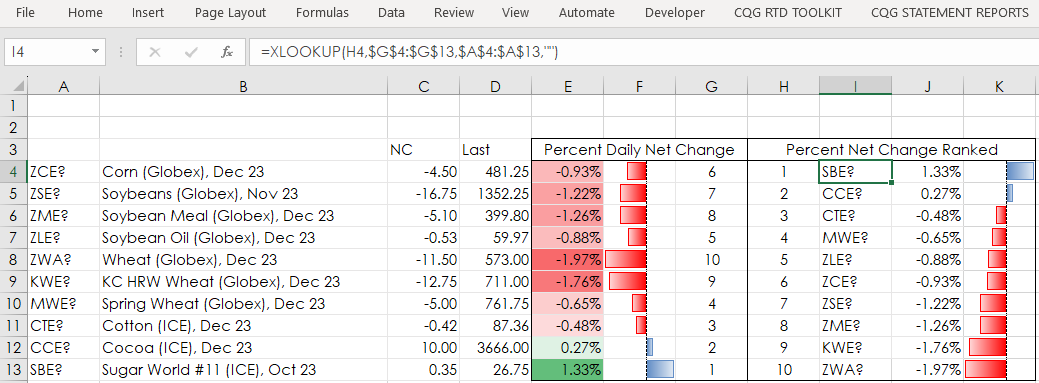
Microsoft® Office 365 includes the latest version of Excel which comes with some new functions not available in Excel 2016 or Excel 2019. This post details the XLOOKUP function and its features.… more
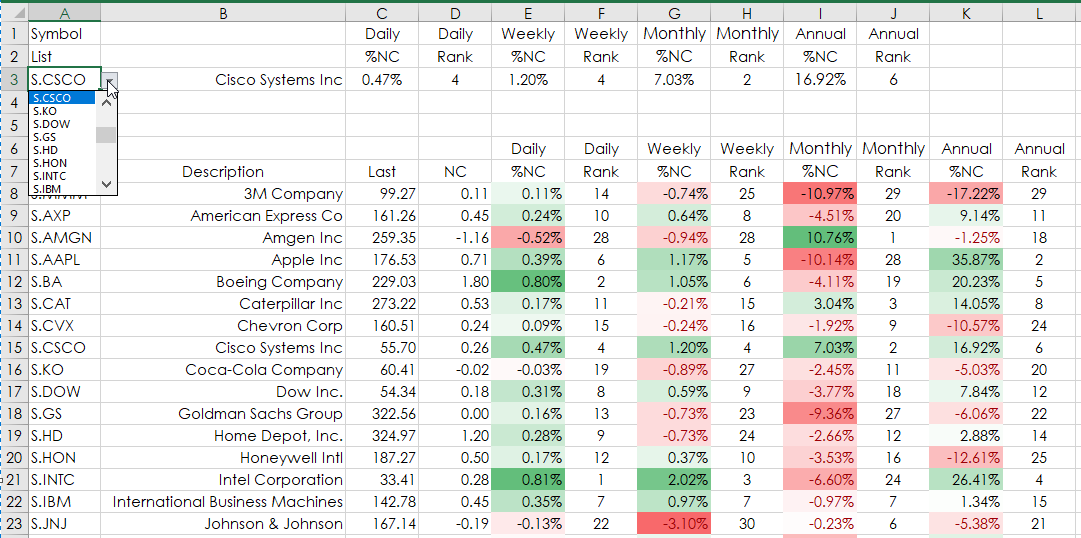
This post details how to use Excel’s Index and Matching function to extract data from a table. The example (downloadable sample at the bottom of the post) uses the 30 stocks in the DJIA as a… more
This Microsoft Excel® dashboard displays all of the JPX-traded Three-Month TONA contracts including volume and open interest data.
The first three columns detail the contract month… more
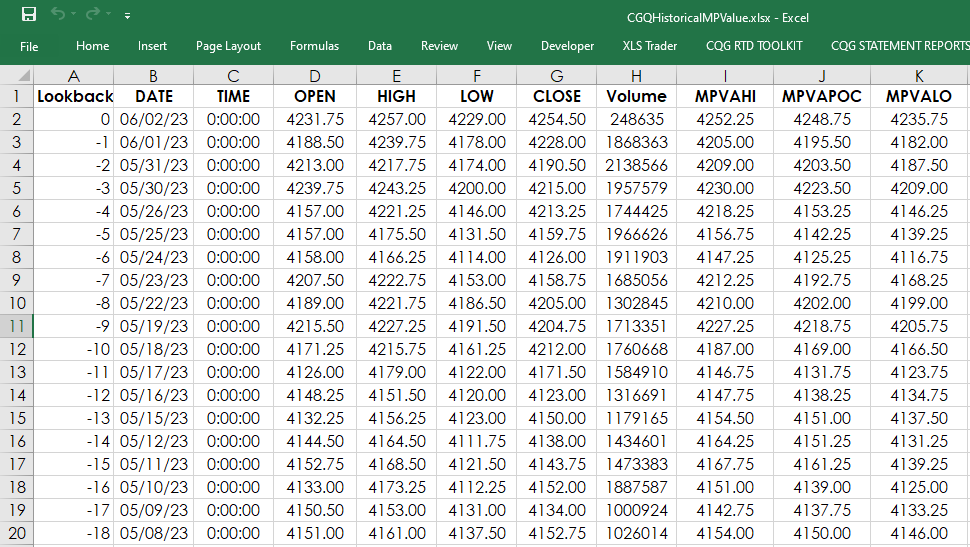
This study calculates the Market Profile’s value area and point of control (POC). First, a brief overview of the Market Profile chart then the Excel RTD formulas for MPVAPOC, MPVAHigh and the… more
This Microsoft Excel® dashboard displays all of the ICE-traded Three-Month SONIA contracts including volume and open interest data.
The first three columns detail the contract month… more
This Microsoft Excel® dashboard displays all of the Globex-traded Three-Month SOFR contracts including volume and open interest data.
The first three columns detail the contract… more