CQG IC and QTrader offer two studies that track volatility: Implied Volatility and Historical Volatility. This post details each study and provides an Excel spreadsheet for tracking the two.
Implied Volatility
Implied Volatility is different than Historical Volatility, which uses a simple Standard Deviation-based formula. Implied Volatility is calculated using several variables, such as actual option price, underlying price, strike price, and expiration date. These variables are used in the Cox-Ross Rubenstein model and solves for volatility. Thus, this value represents the volatility implied by the other variables.
CQG uses the volatilities implied by the Cox-Ross Rubenstein model and calculates weighted averages of some of the possible underlying expiration prices.
The study has four outputs:
- Call IV
- Put IV
- Both call and put (Merged IV)
- Call/Put spread
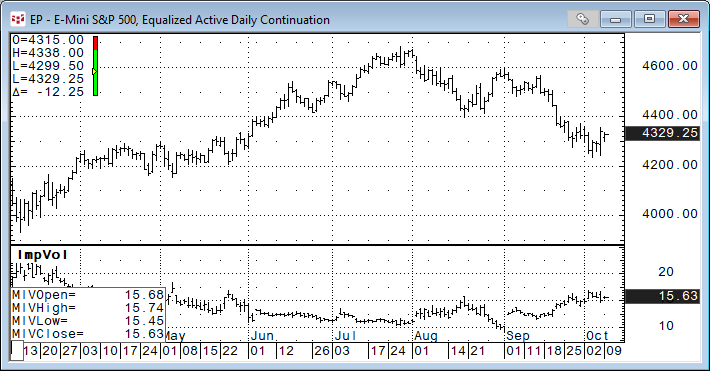
The image below is displaying Merged IV. Notice the study is an Open, High, Low and Last bar chart.
More details regarding the Implied Volatility study are found in the Help file.
A quick glance at the image above and implied volatility tends to fall during a market advance and rise during a market decline.
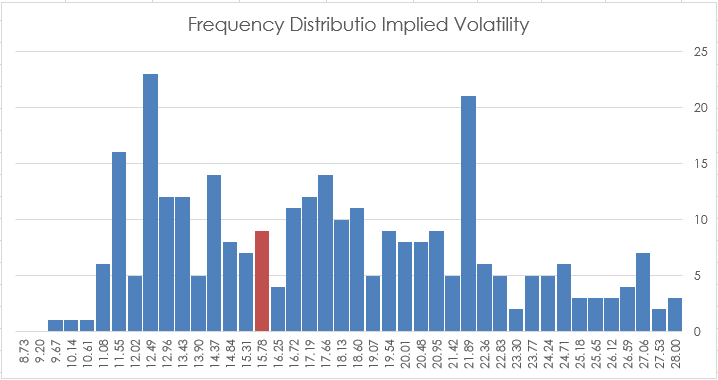
One challenge is identifying when Implied volatility is high or low. At the bottom of this post is a macro enabled Excel spreadsheet that calculates frequency analysis of the Implied Volatility and displays 40 histogram bars from the lowest implied volatility to the highest volatility. These are considered bins. Excel breaks down the number of occurrences within each bin. The bin with the current implied volatility is highlighted. More about frequency distribution is found here.
Historical Volatility
Historical Volatility is defined as the standard deviation of a series of price changes measured at regular intervals. It can be used in conjunction with Implied Volatility to gauge how the market’s current expectations differ from history.
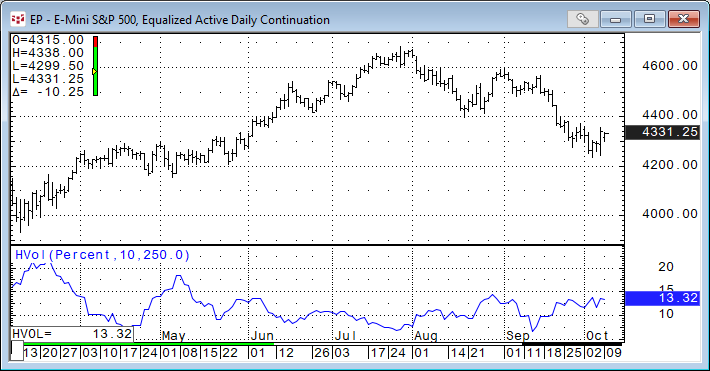
The Historical Volatility display appears in a window below its corresponding chart.
CQG allows the user to define the Historical Volatility using either Percent or Logarithmic price.
High/Low Range changes use a different approach to the standard deviation way of calculating historical volatility. This approach uses high/low ranges that convey much more information than a simple chart of closing prices.
User choices:
- Percent
- Log
- Hi-Low Range
Period = Number of bars in the lookback range.
And an Annualization Factor.
More details regarding the Historical Volatility study are found in the Help file.
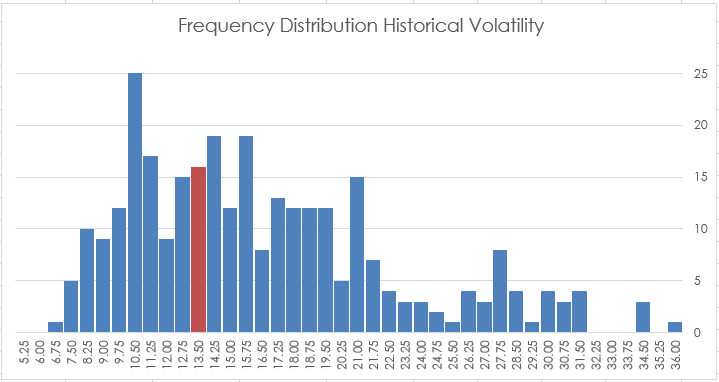
The Excel sample posted at the bottom of the article includes a Frequency Distribution analysis of Historical Volatility.
The Excel sample has a cell to enter in the symbol and the time frame. Excel’s default charting does not scale very well, so the spreadsheet is macro-enabled. There is a button to rescale all charts on the worksheet tab to better fit the windows.