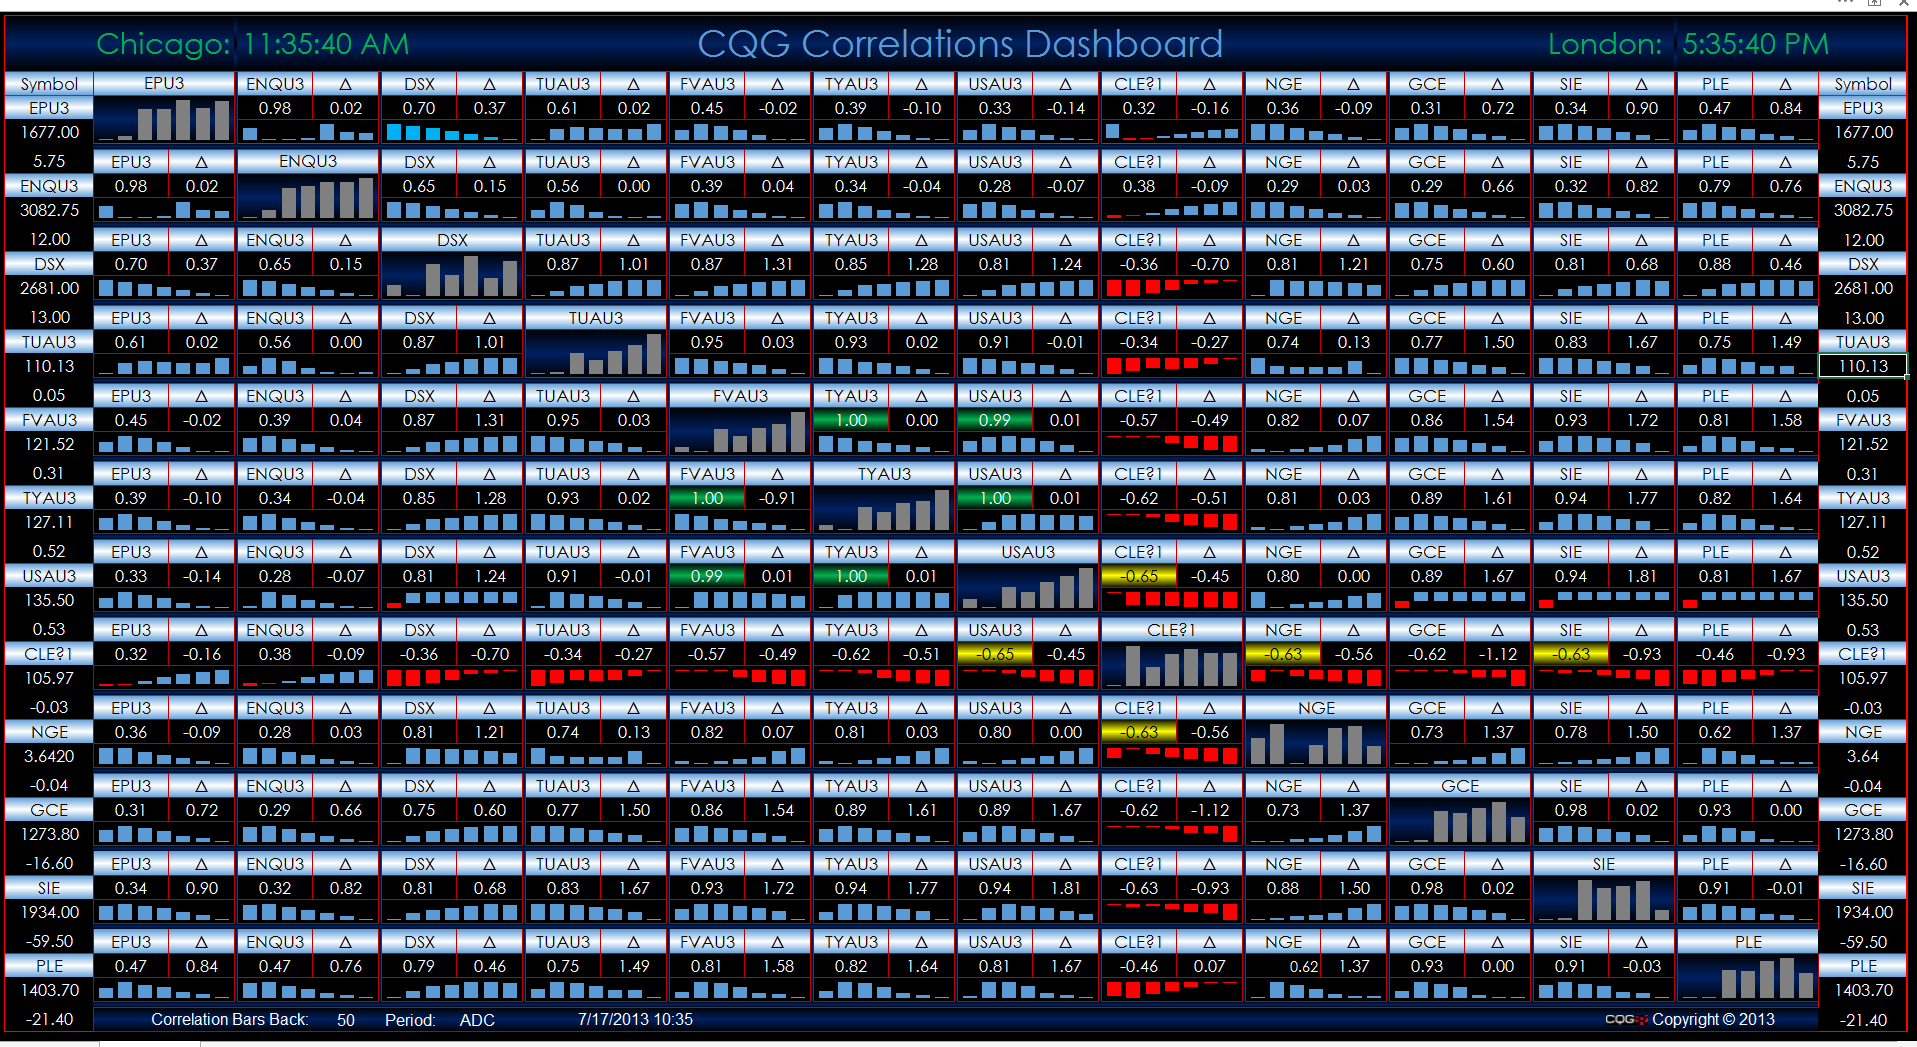
This correlation dashboard gives you sparklines to see the most recent changes in the correlation. Enter the symbols down the left-hand column. Change the look back period and the timeframe at the… more
Thom Hartle
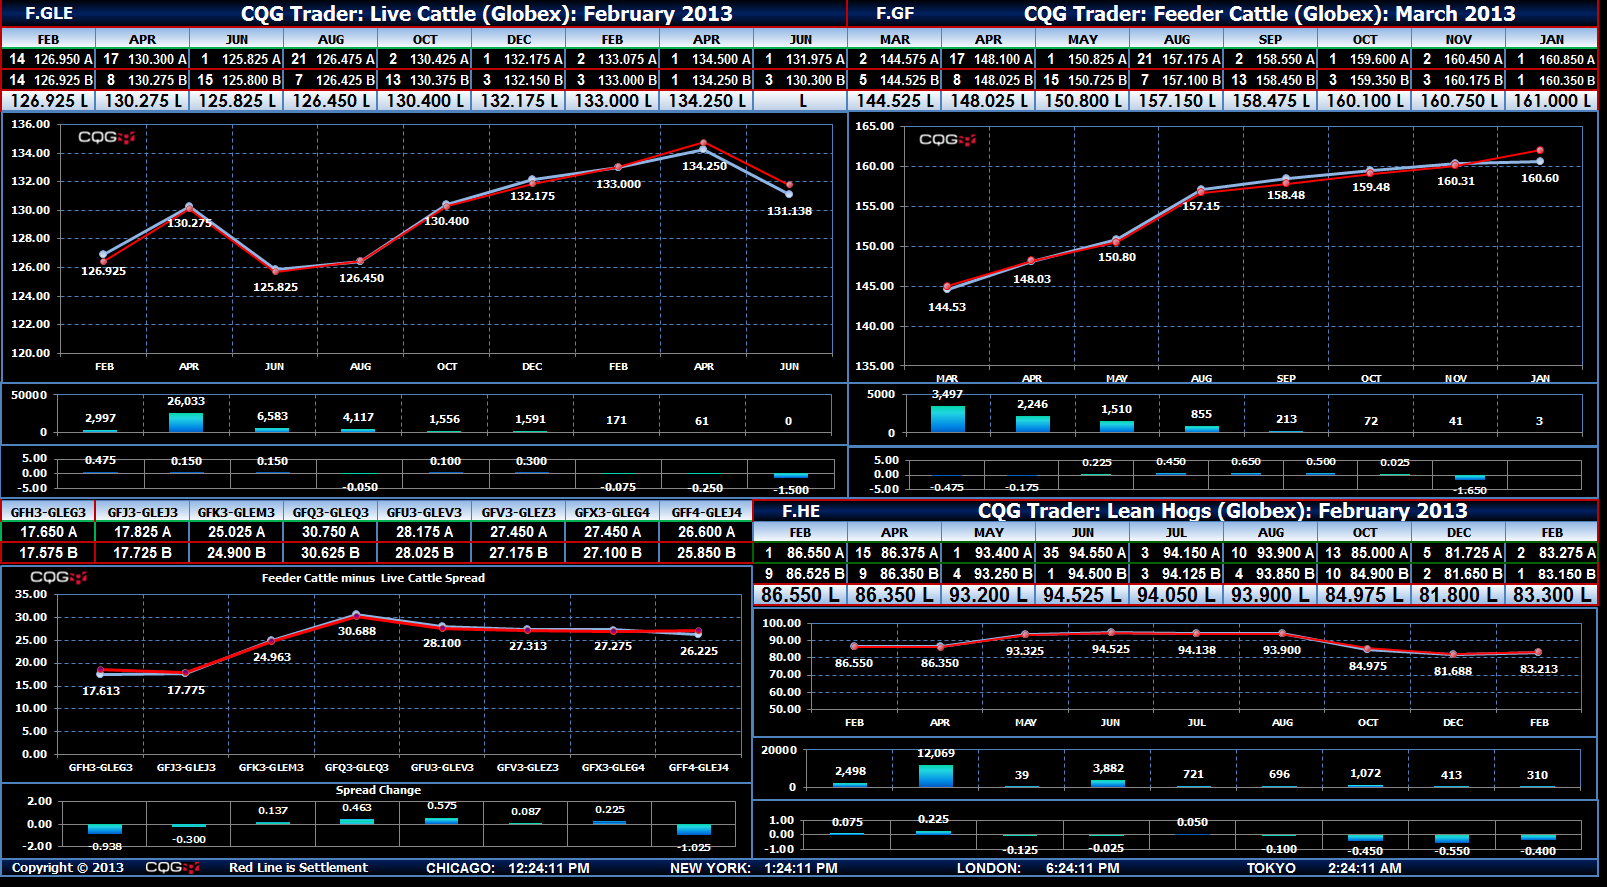
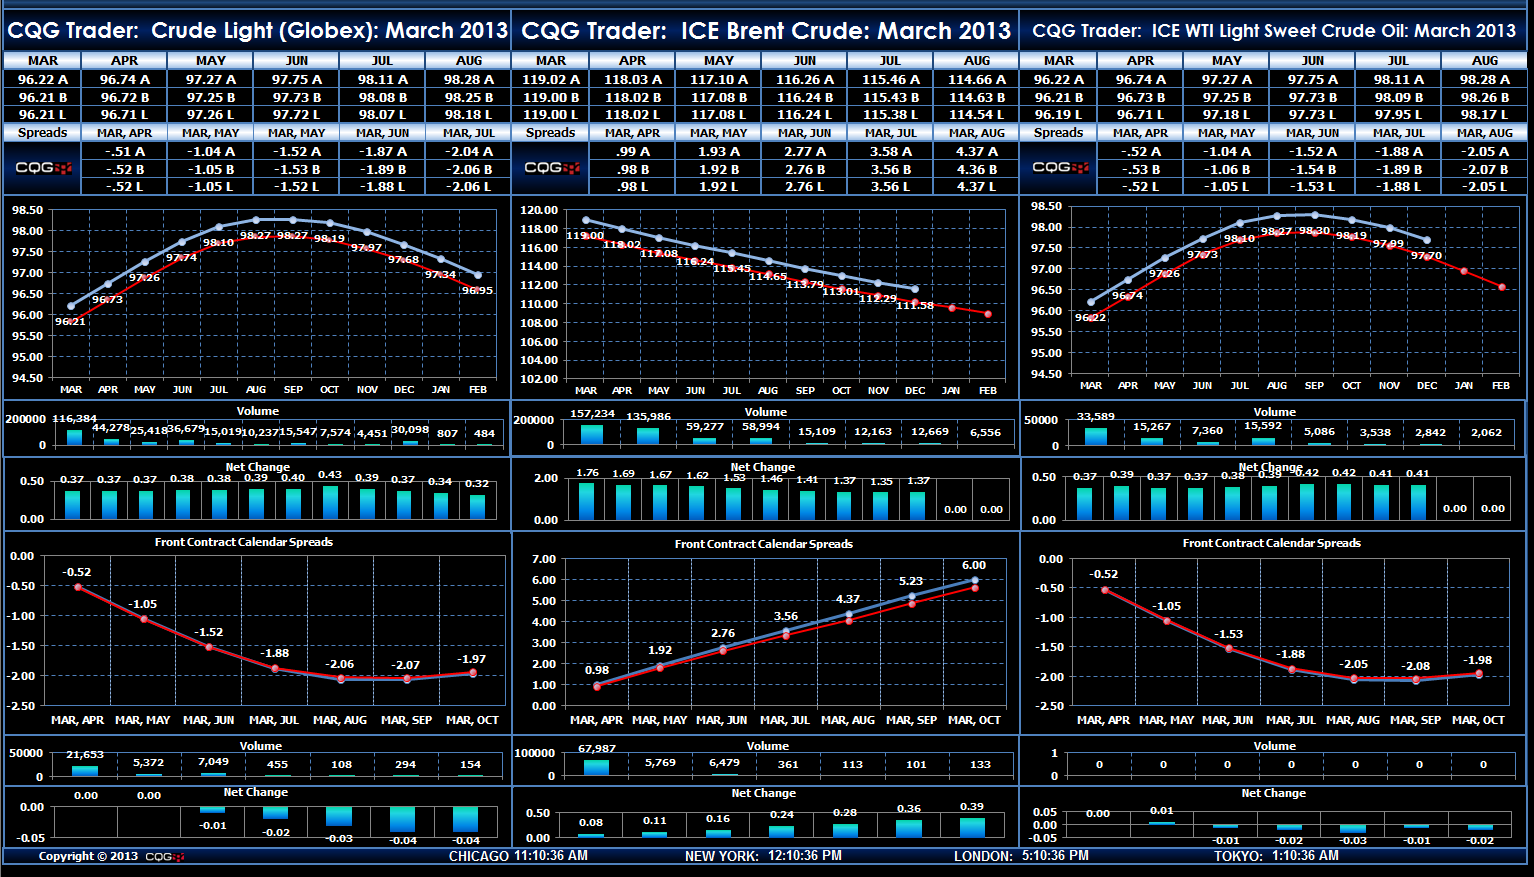
Track the roll between futures contracts using this dashboard. The daily volume is displayed side-by-side on the volume chart and the open interest values are displayed as overlaid line charts.… more
To access the RTD feature in CQG Trader, please contact your FCM. (CQG Trader RTD only works with 32-bit Excel).
This spreadsheet displays the current last, best bid, and best ask prices… more
To access the RTD feature in CQG Trader, please contact your FCM. (CQG Trader RTD only works with 32-bit Excel).
This spreadsheet displays the current market data, last price, best bid, and… more
To access the RTD feature in CQG Trader, please contact your FCM. (CQG Trader RTD only works with 32-bit Excel).
This spreadsheet displays the current last, best bid, and best ask prices… more
To access the RTD feature in CQG Trader, please contact your FCM. (CQG Trader RTD only works with 32-bit Excel).
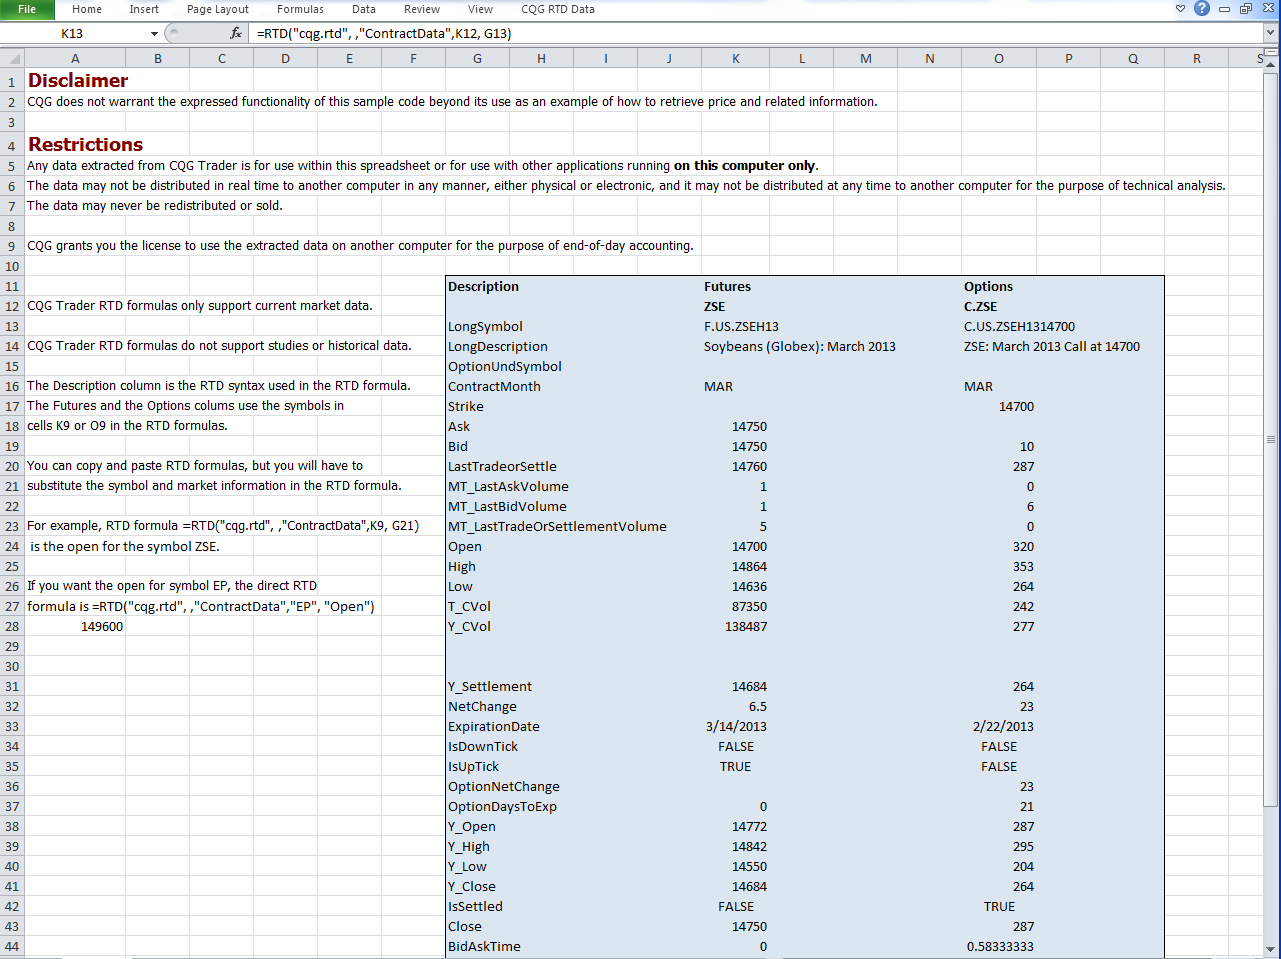
This spreadsheet displays the RTD formulas needed to bring market data from… more
To access the RTD feature in CQG Trader, please contact your FCM. (CQG Trader RTD only works with 32-bit Excel).
This dashboard allows you to change symbols as well as enter a value for the… more
This spreadsheet provides a list of RTD formulas for historical bars and charting, requesting study data and study-related curves, calling a set of historical bars of all supported types, and… more
This spreadsheet provides a list of all available labels in market data in all types of contracts, including synthetic spreads. Orders and related statistics data include number of… more
This spreadsheet outlines the basic syntax of RTD formulas and then details more complex formulas. Included is a collection of popular RTD formulas, which you can simply copy and paste into your… more
