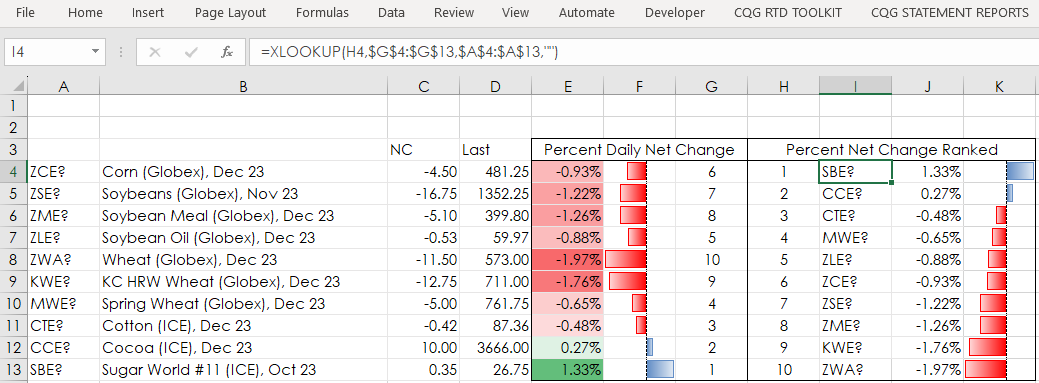
Microsoft® Office 365 includes the latest version of Excel which comes with some new functions not available in Excel 2016 or Excel 2019. This post details the XLOOKUP function and its features.… more
Workspaces
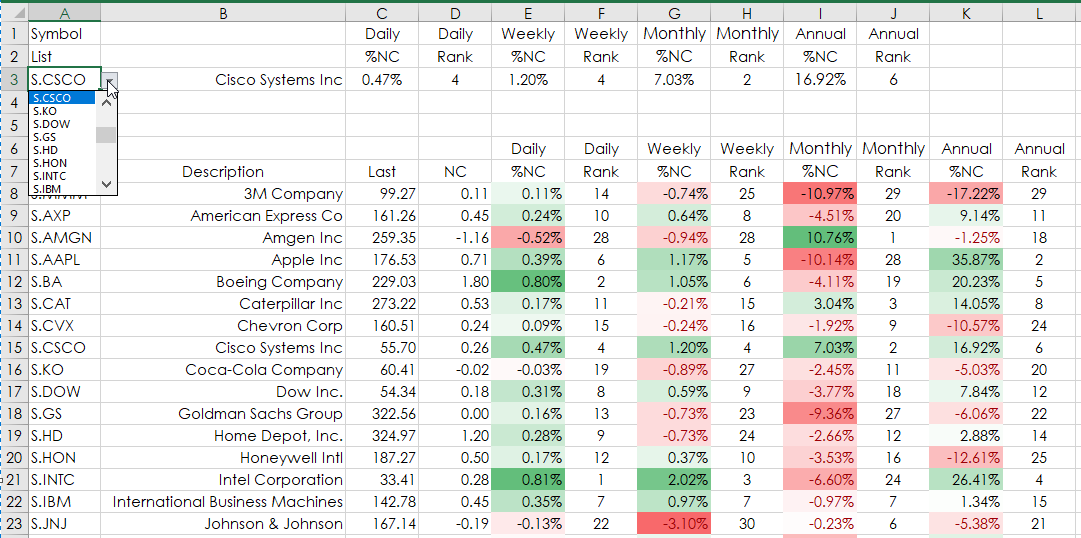
This post details how to use Excel’s Index and Matching function to extract data from a table. The example (downloadable sample at the bottom of the post) uses the 30 stocks in the DJIA as a… more
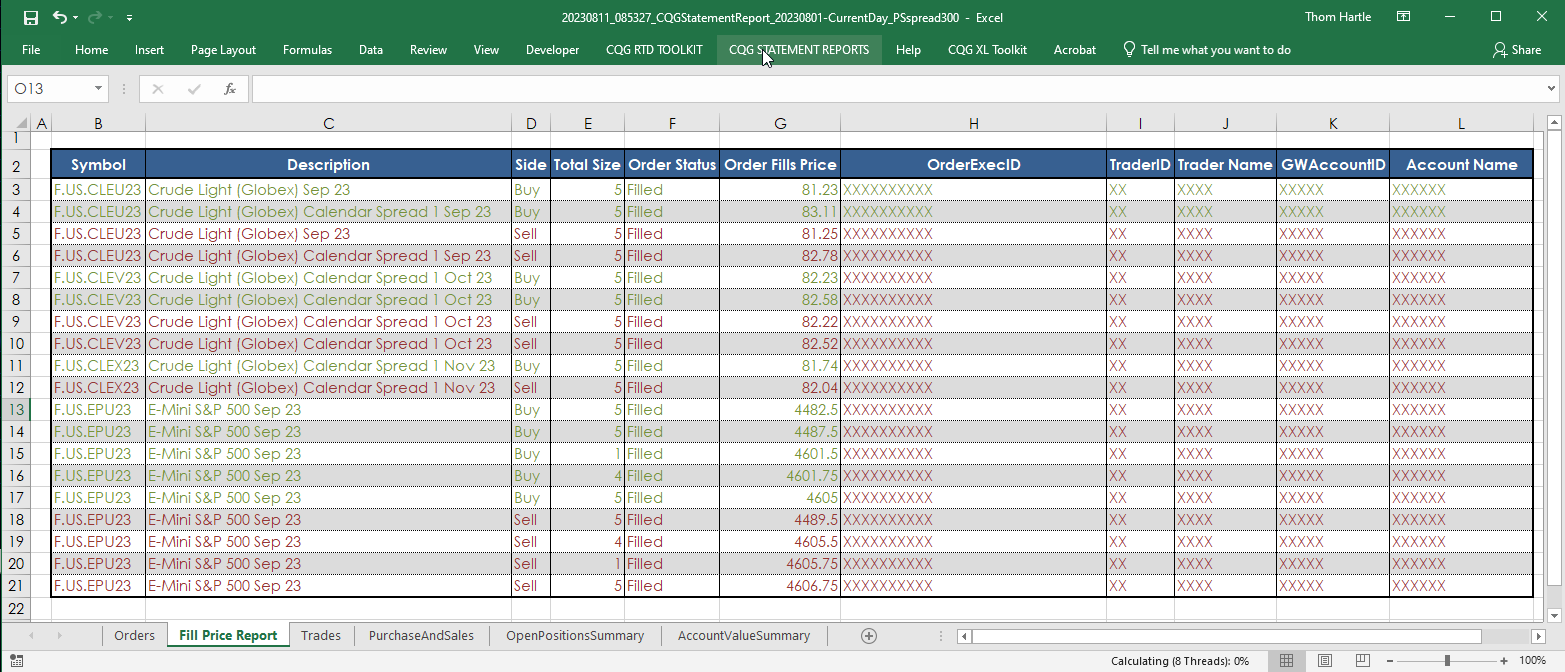
The CQG Statement Reports Add-In is installed with CQG IC and QTrader. This add-in works with CQG’s Statement Report generated from the Orders & Positions window.
Once you… more
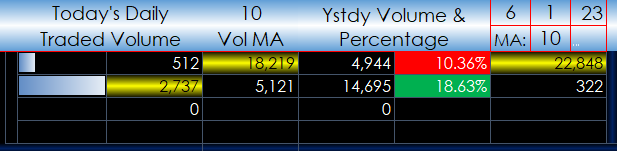
This Microsoft Excel® dashboard displays all of the JPX-traded Japanese Government Bonds (JGB) contracts including volume and open interest data.
The first three columns detail the… more
This Microsoft Excel® dashboard displays all of the JPX-traded Three-Month TONA contracts including volume and open interest data.
The first three columns detail the contract month… more
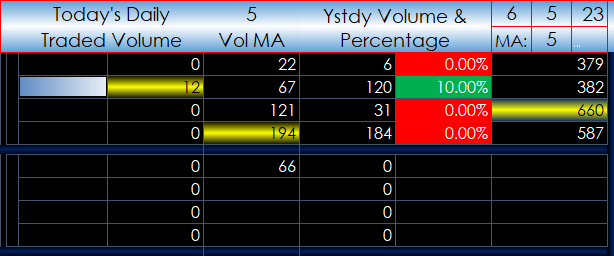
This Microsoft Excel® dashboard displays all of the ICE-traded Three-Month SARON contracts including volume and open interest data.
The first three columns detail the contract month… more
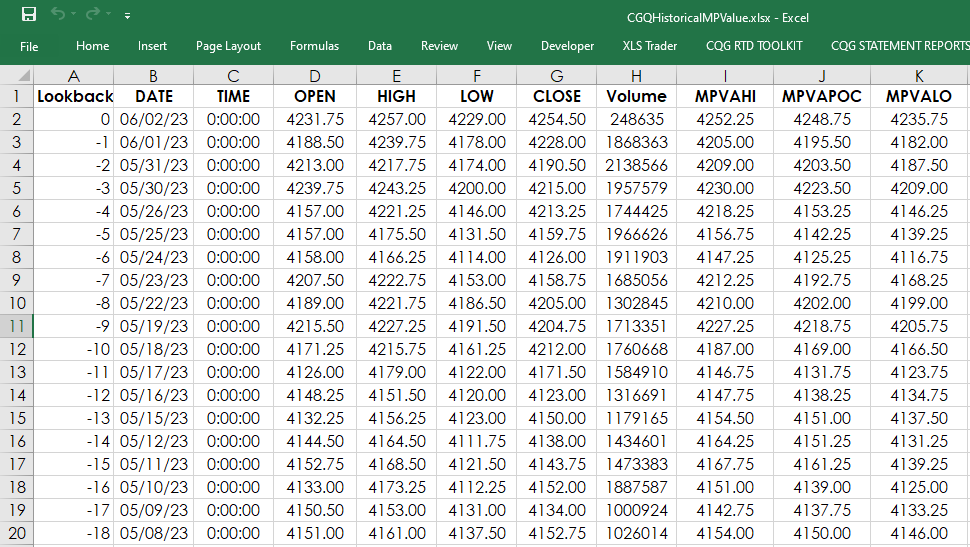
This study calculates the Market Profile’s value area and point of control (POC). First, a brief overview of the Market Profile chart then the Excel RTD formulas for MPVAPOC, MPVAHigh and the… more
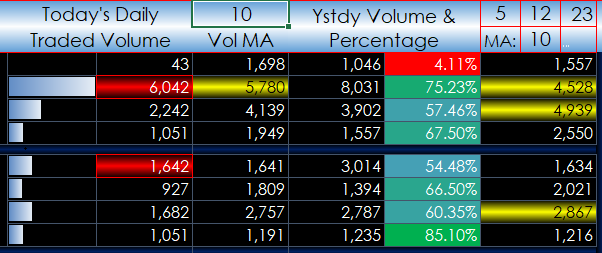
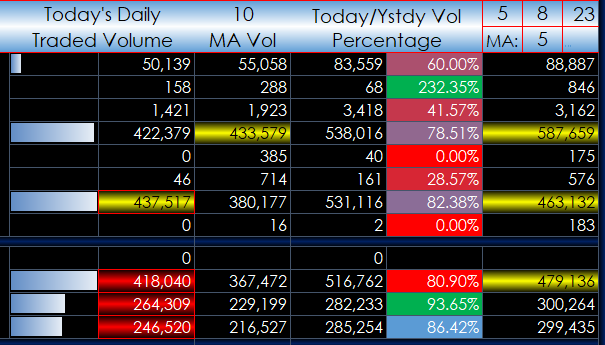
This Microsoft Excel® dashboard displays all of the ICE-traded Three-Month SONIA contracts including volume and open interest data.
The first three columns detail the contract month… more
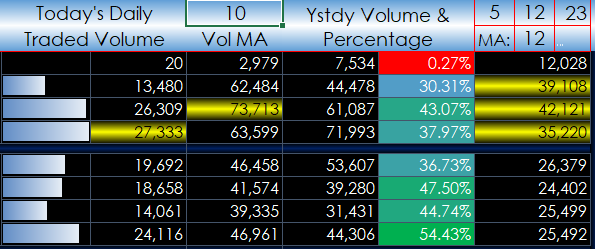
This Microsoft Excel® dashboard displays all of the Globex-traded Three-Month SOFR contracts including volume and open interest data.
The first three columns detail the contract… more
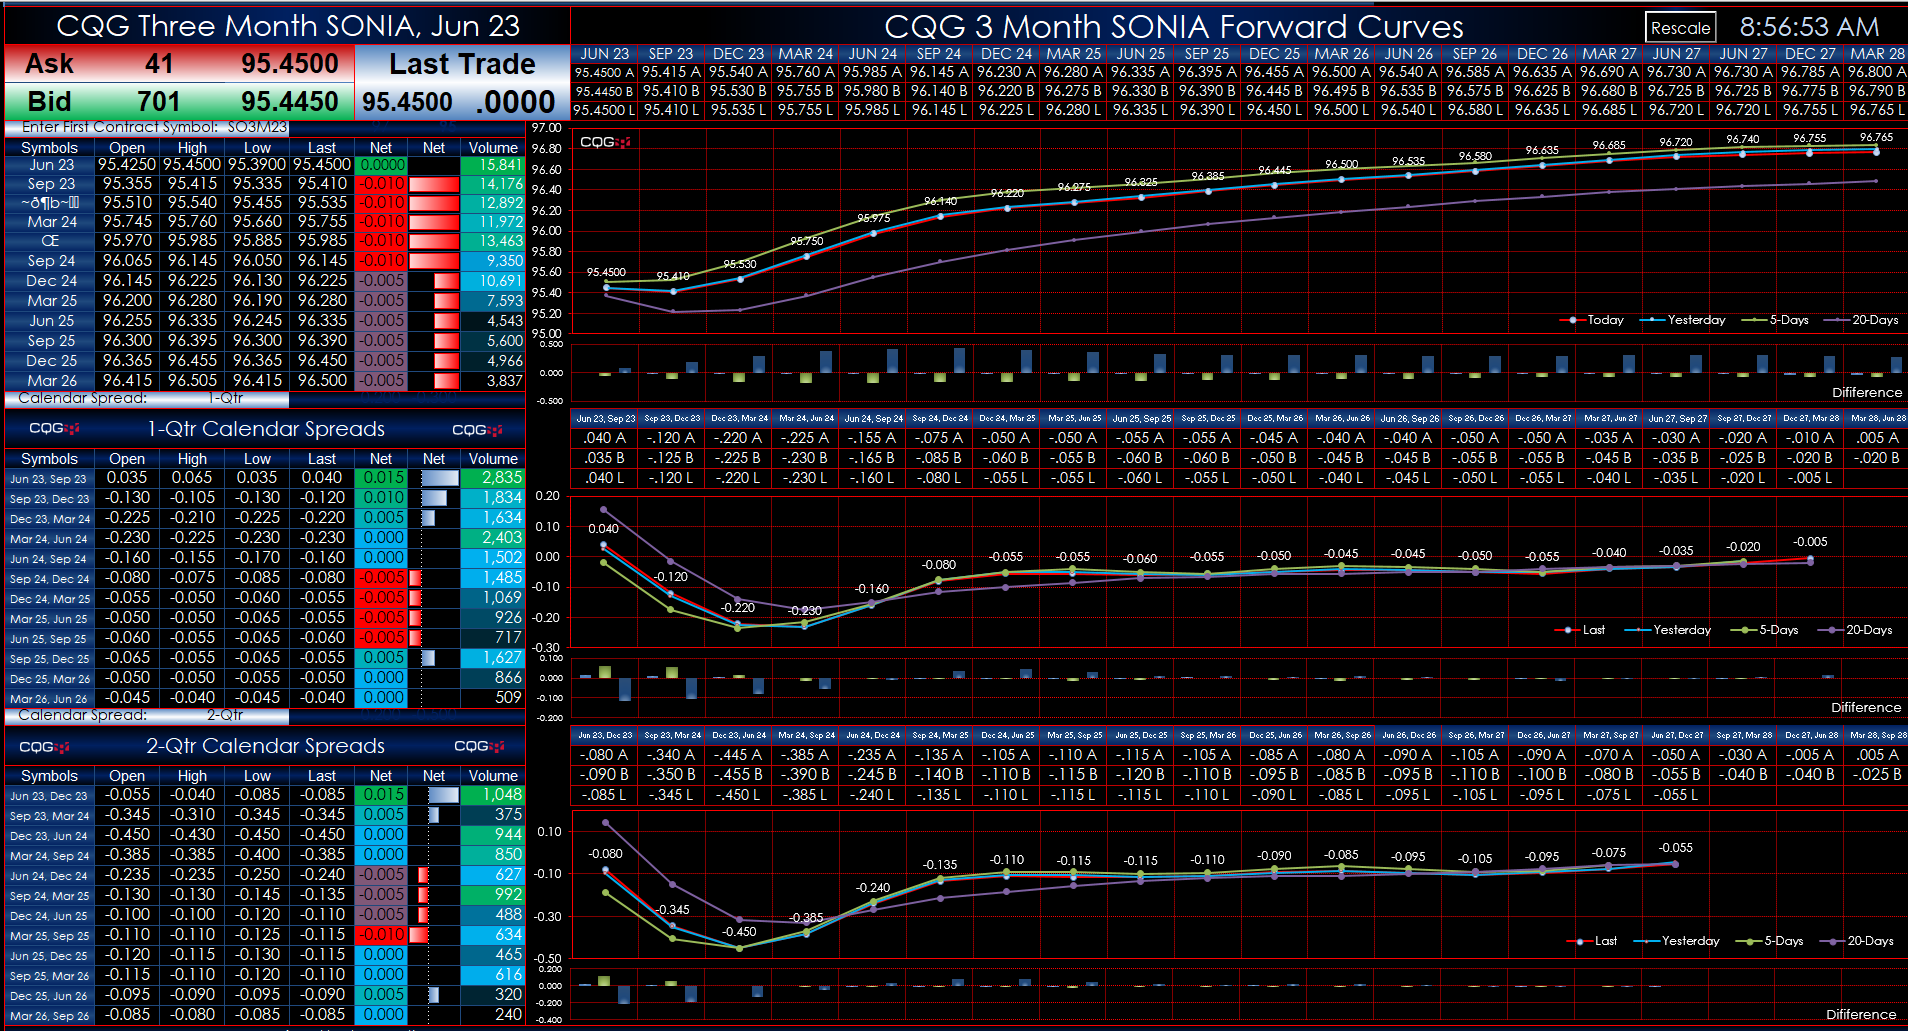
This Microsoft Excel® macro enabled dashboard pulls in the Three Month SONIA Index Futures Contract which is a cash settled future based on the interest rate on a three month sterling deposit.… more