This Microsoft Excel® dashboard uses the CQG RTD OptVal formula to calculate implied volatility, theoretical value, delta, and the Greeks using data inputs from other RTD formulas.
… more

This Microsoft Excel® dashboard uses the CQG RTD OptVal formula to calculate implied volatility, theoretical value, delta, and the Greeks using data inputs from other RTD formulas.
… more

Watch this webinar to see how Mr. Borish trades consolidated breakouts using CQG Integrated Client. It's one thing to derive a buy or sell signal, but it's another to filter out the noise of the… more
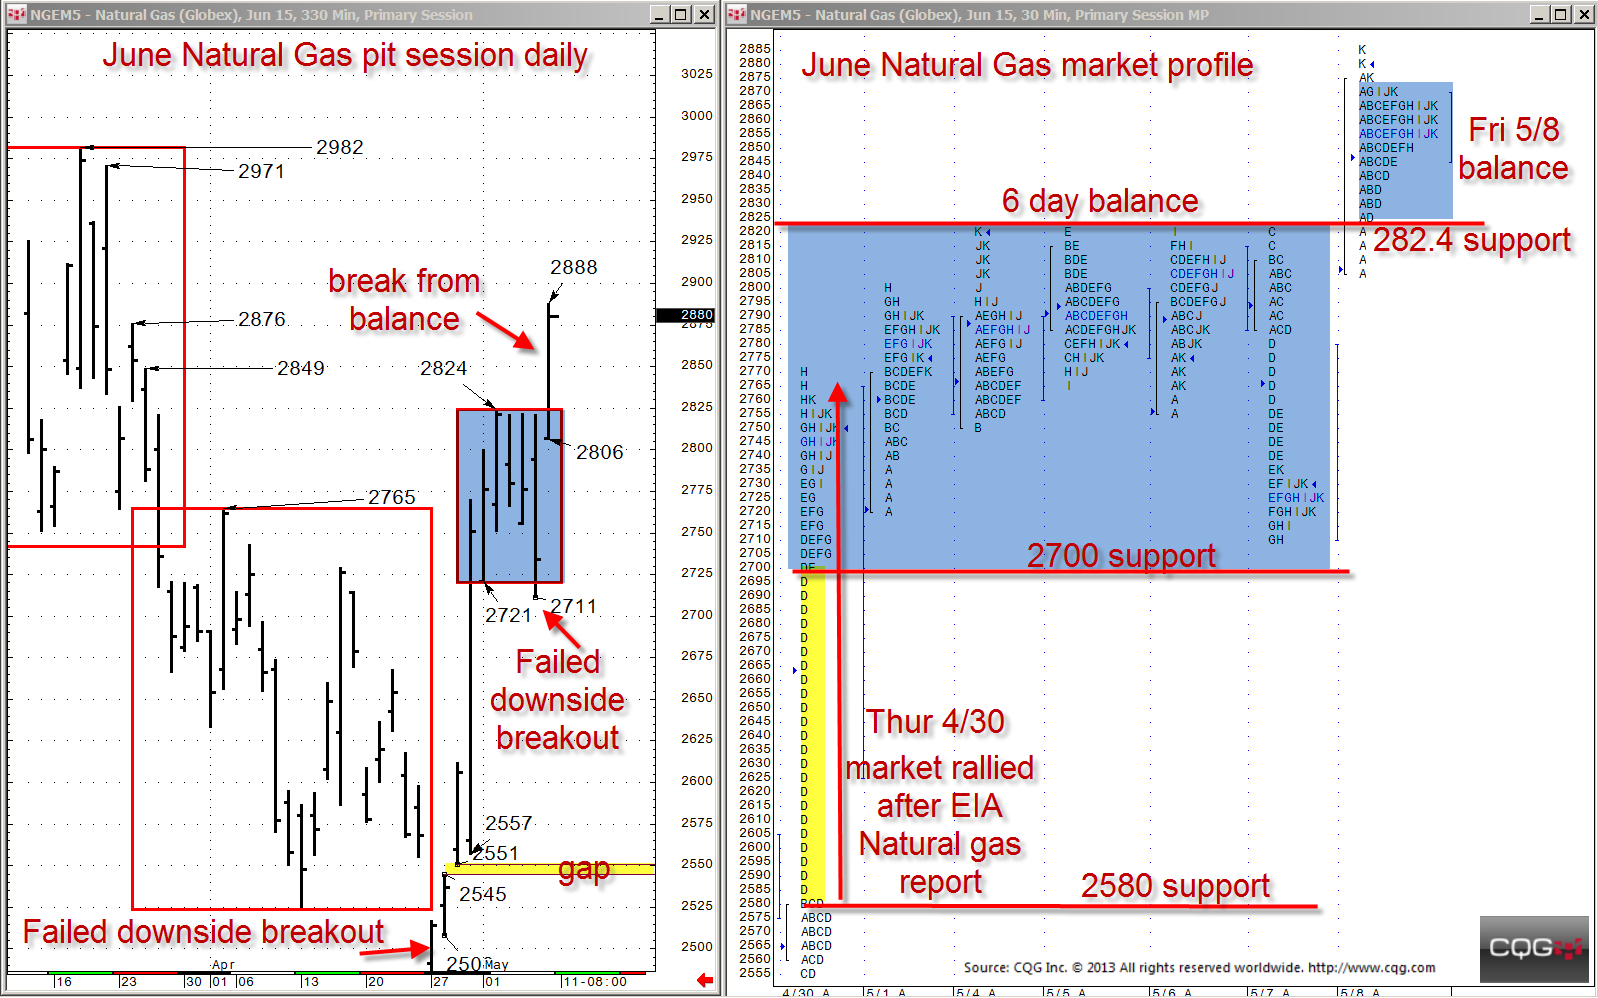
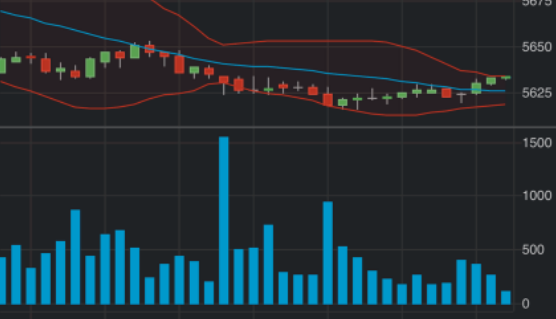
From the middle of March until the end of April, June natural gas held a steady decline from about 290.0 down to below 250.0. However, over the last ten days, much of that decline has been… more

This Microsoft Excel® dashboard offers an automatic performance ranking of exchange-traded funds (ETFs) that is focused on equity performance by country. This dashboard requires the NYSE… more
New York, April 27, 2015 - INTL FCStone Inc., a diversified financial services organization delivering financial products, advisory and execution services to commercial customers around the… more
We're excited to launch some important features in this version of CQG M. The new version is live on stage (https://mdemo.cqg.com) and will be moving to production (https://m.cqg.com) in… more
This Dow Jones News newsletter highlights some of the top coverage from Dow Jones' newsrooms around the world. The newsletter's focus is Central Banks, and coverage highlights include:
… more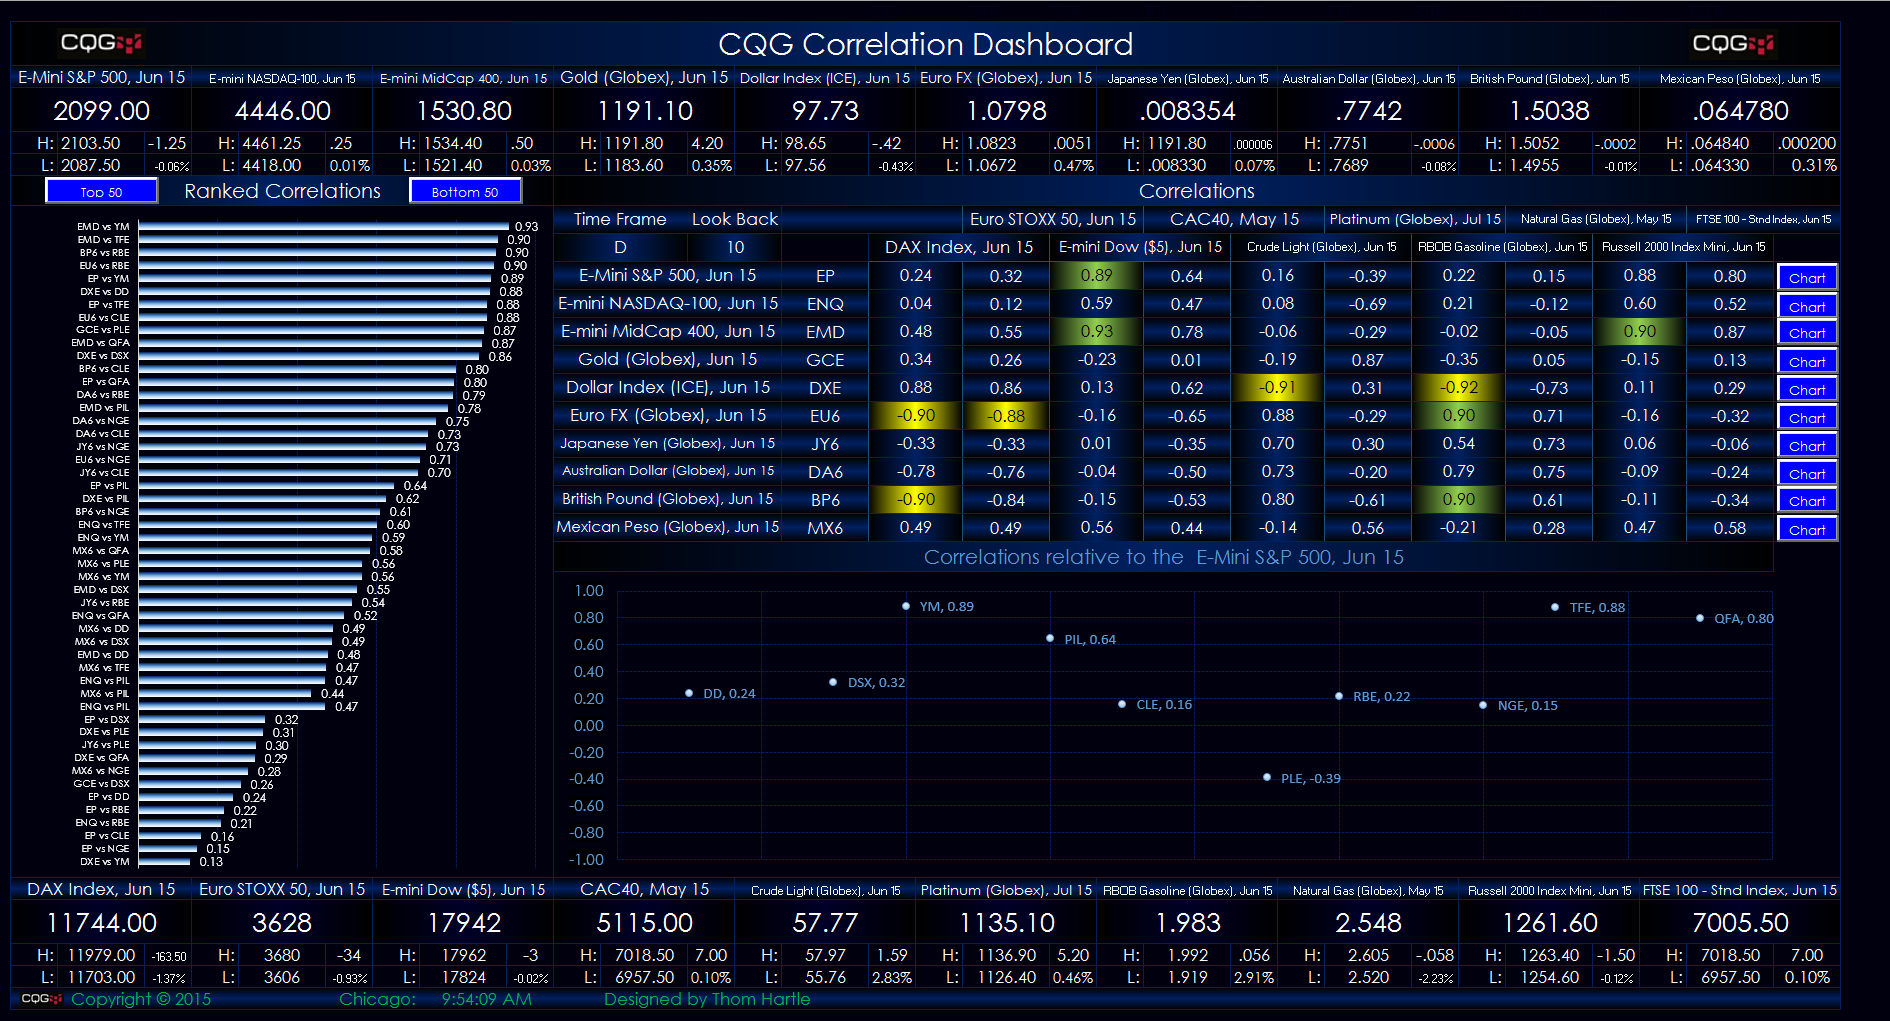
This Microsoft Excel® spreadsheet presents a 10-by-10 correlation matrix. In addition, a dynamically ranked view of the correlations from the 10-by-10 correlation matrix is displayed as histogram… more
In a previous version, we launched the charting feature and the first few studies. In this version, we added Volume, RSI, MACD & Stochastics… more