Will the Recovery Hold?
In June 2014, active month NYMEX crude oil was trading north of $107 per barrel. The price moved to lows of $42.03 by the middle of March 2015 - a decline of around 61%. The move lower began as a response to increasing production and record inventories of crude oil in the United States. In November, OPEC announced that there would be no production cut. Oil plummeted and many analysts called for prices to move to the 30s, 20s, and some even called for lower prices. In an interview with Dennis Gartman on CNBC, the commodity expert said that prices could fall to $10 and crude oil could go the way of whale oil. As often happens in the world of commodities, the bearishness reached an apex as oil moved to its nadir. March marked the recent lows for oil, which spent the month of April and early May recovering.
Oil Bounces after an Ugly Selloff
It has been a slow and steady recovery for the price of crude oil.
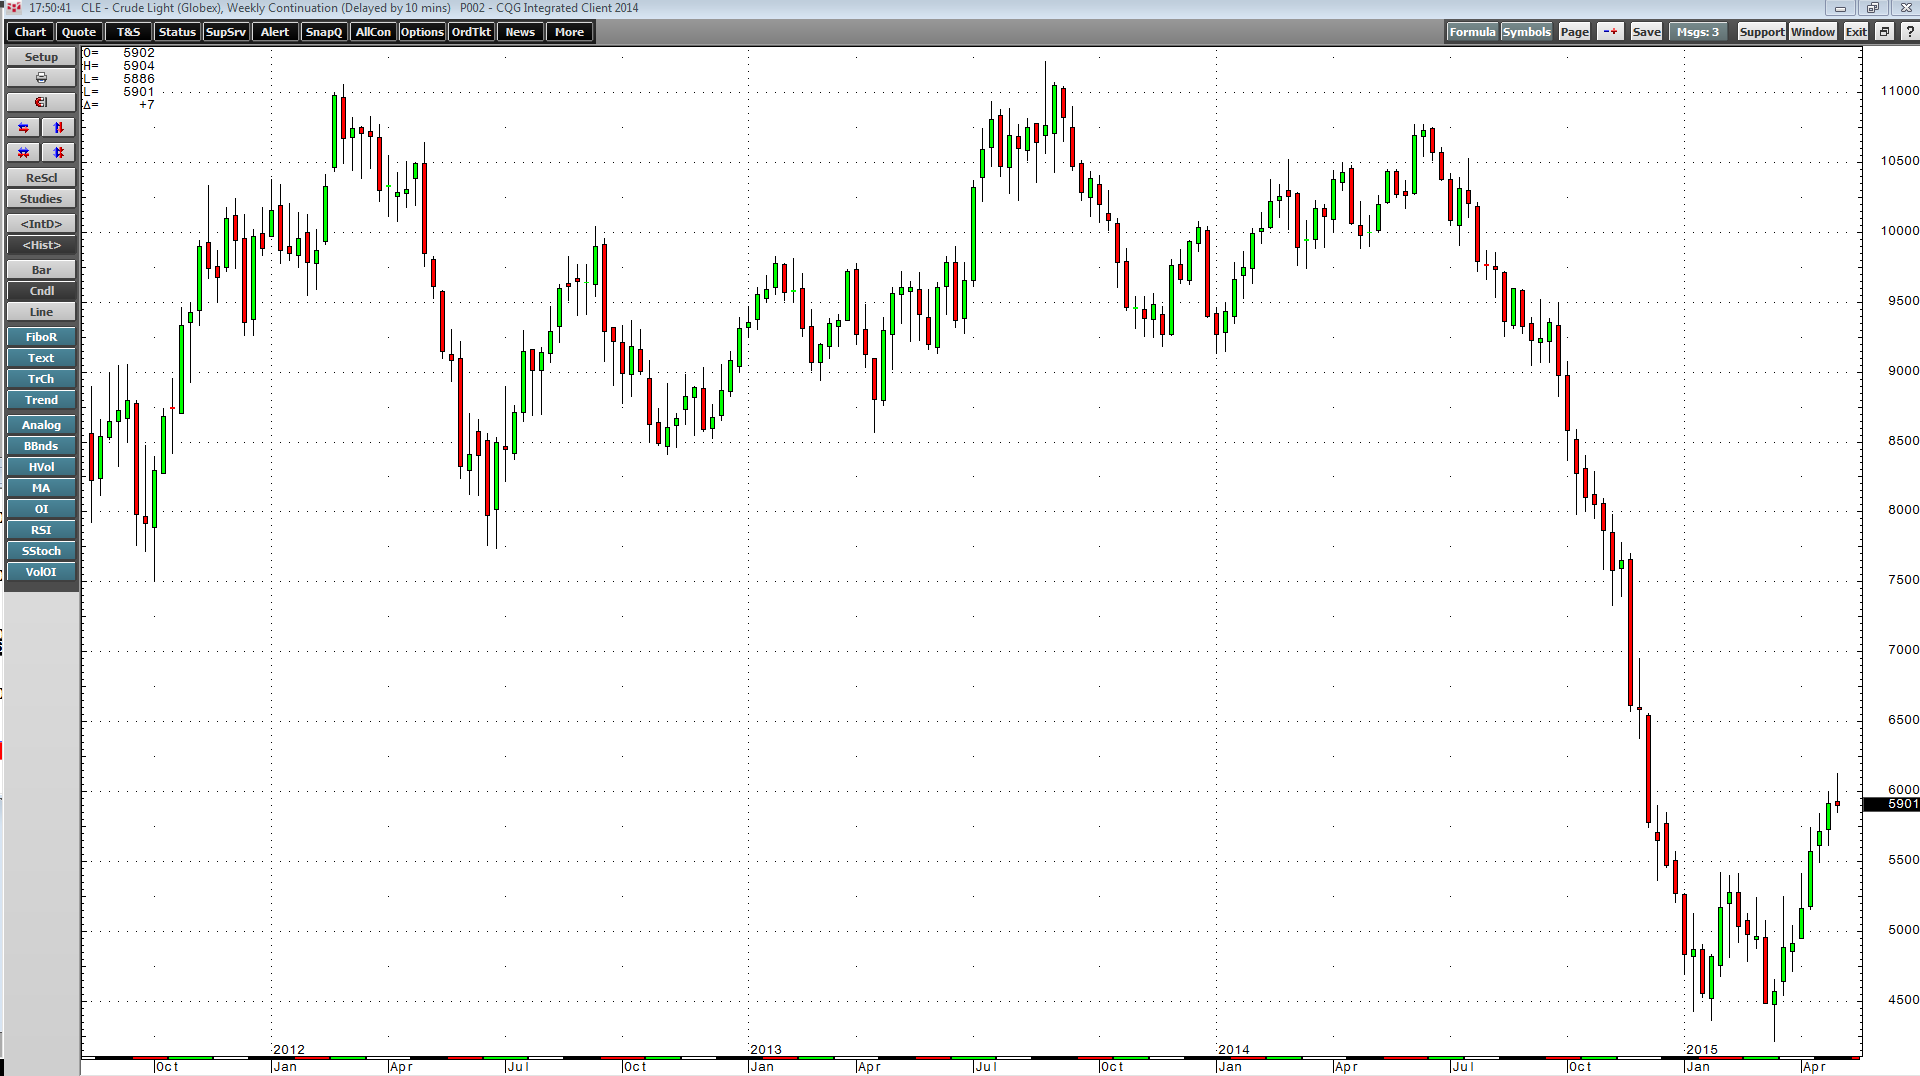
As the chart above illustrates, crude oil bounced, moving higher for the past seven consecutive weeks. There are many reasons for the recovery. A decline in US rig counts will eventually translate into lower production. Tension in the Middle East continues to threaten many countries that are major producers. The extreme bearish consensus a few short months ago increased short selling and nothing can ignite a recovery like an excessive number of shorts. Meanwhile, there were clues in January that a recovery was on the horizon.
Market Structure Provided Clues
Market structure is comprised of all of the variables that make up the ultimate price of a commodity. In the oil market, structure includes location spreads, refining or crack spreads, time or calendar spreads, as well as other factors. The first clue that oil was coming close to a bottom appeared in February when refining spreads began to move higher. Consumers do not buy raw crude oil; they buy oil products like gasoline and heating oil. Crack spreads, which represent the economics of processing raw crude oil into these oil products, bottomed in January and began moving aggressively higher throughout February and into March.
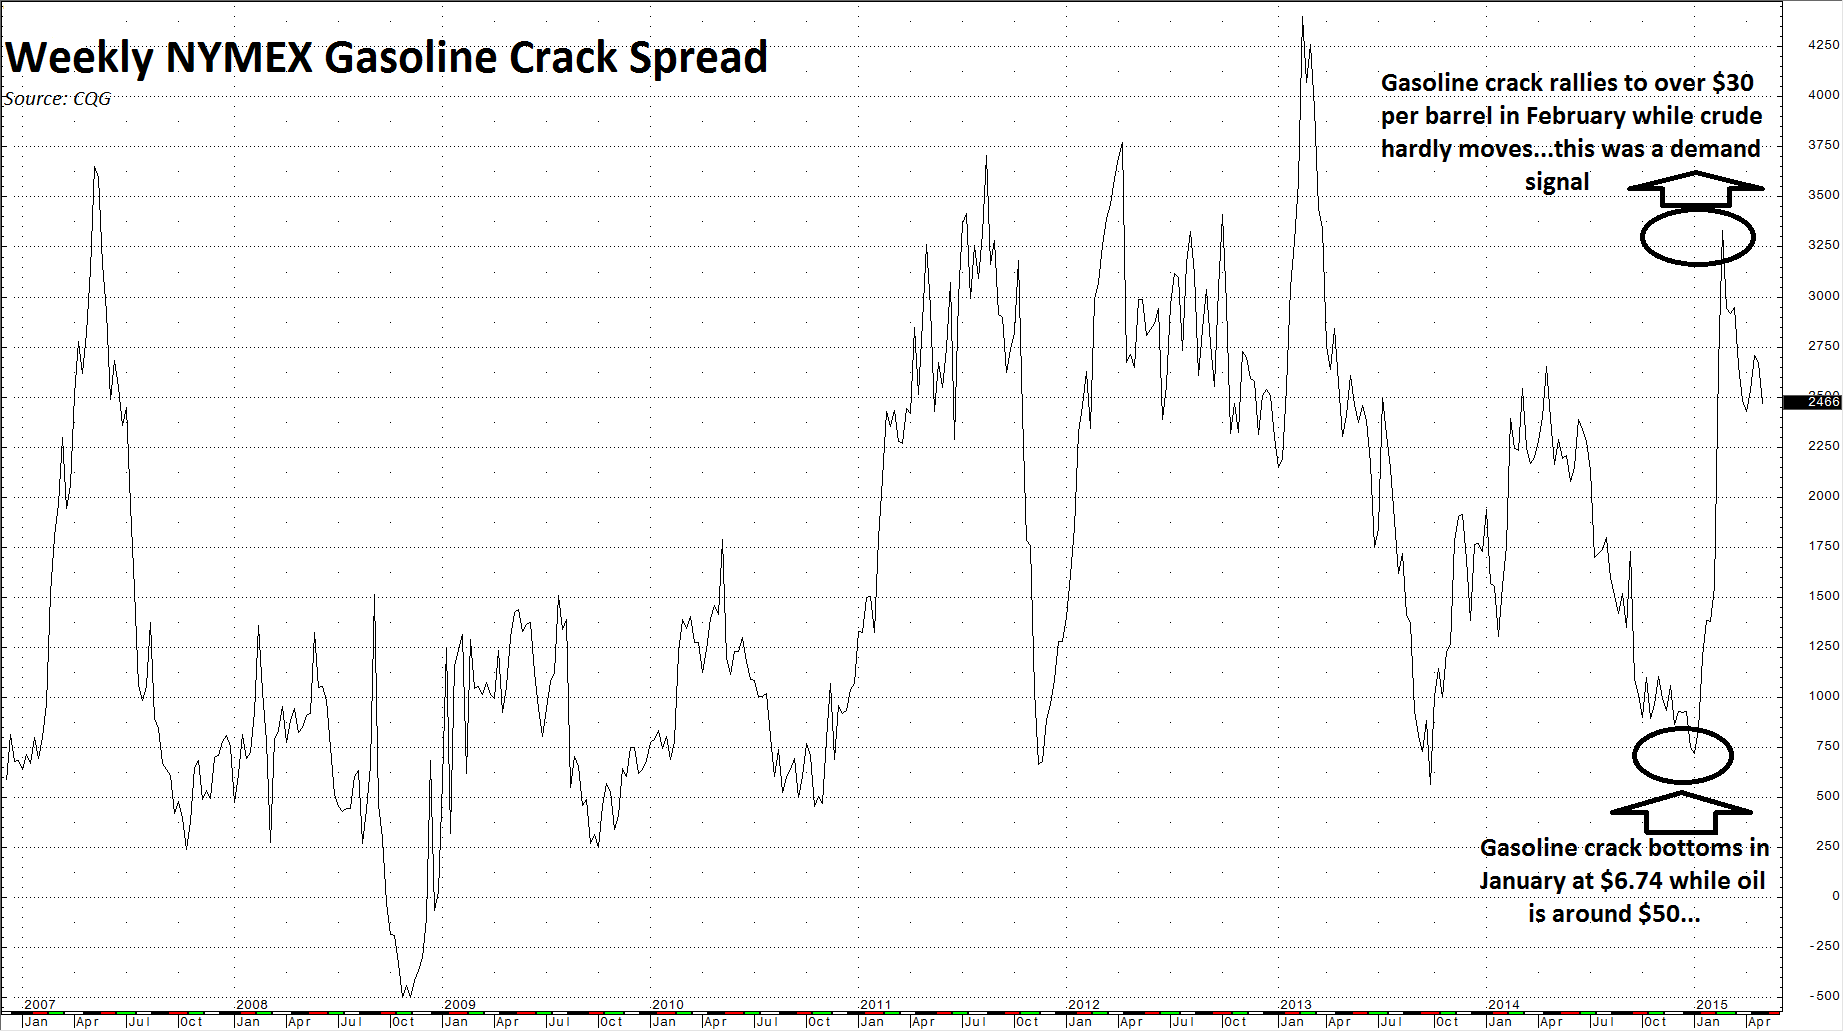
In January, the gasoline crack spread bottomed at $6.74 and then proceeded to rally. This processing spread moved north of $30 per barrel by February, quite an astonishing move. Gasoline prices rallied while crude oil prices hardly moved. The oil product outperformed the raw crude. We can attribute a move like this in gasoline to seasonal factors: gasoline cracks tend to bottom during the middle of winter and then rally when spring is on the horizon. However, a similar move in heating oil crack spreads validated that something more important was going on.
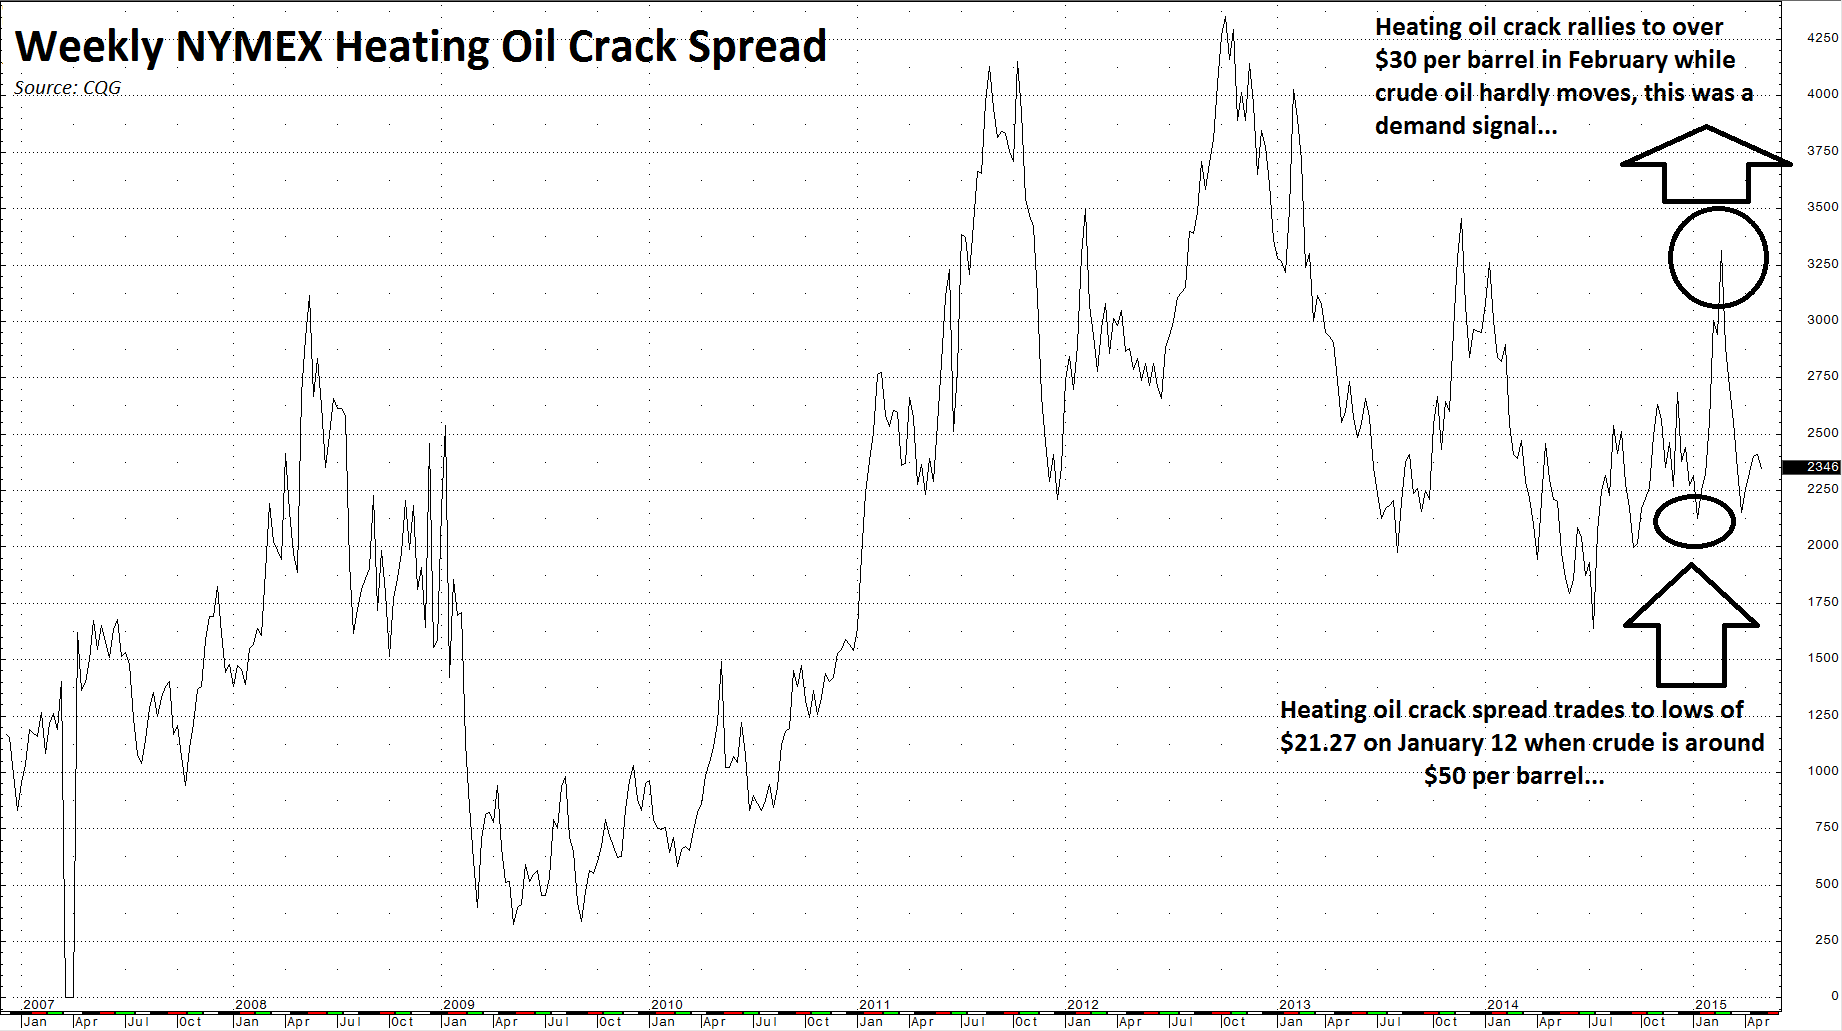
The chart highlights that heating oil processing spreads also exploded higher between the end of January and throughout February, moving from $21.27 to over $33 per barrel. These crack spreads signaled increasing demand for oil products at lower prices, and it is possible that they signaled a bottom for the price of oil.
Additionally, term structure also provides clues. Last June when crude oil began its descent, the NYMEX forward curve was in backwardation. By October it moved into contango. Backwardation is a condition of supply deficit while contango signals oversupply. The contango reached a high of 25% based on one-year crude spreads in March. As the market recovered from the lows, the contango narrowed. On May 7 it closed at around 7.4%. Term structure reflected falling oil prices throughout the second half of 2014 and then rising prices since March of this year. In commodities, market structure provides amazing clues - those who ignore these clues do so at their own peril.
Mixed Signals Still Define Oil
On May 6, active month NYMEX crude traded to highs of $62.58 - the highest level since December. Crude was over $20 or almost 49% above the March lows. Crude closed on May 7 at $58.94.
There are still mixed signals in the oil market. US inventories remain at very high levels. Crack spreads have declined from recent highs to around the $24 level in both gasoline and heating oil. There is a tremendous amount of conjecture in the market as to whether the deal with Iran will result in increasing quantities of Iranian crude oil sold into the market. There are bullish and bearish factors pulling crude oil in both directions today.
The Bottom Line
Crude oil was a one-way ride from June of last year through March. Over coming months, we could see a much more active market with wider daily trading ranges. Keep your eyes on market structure, it always provides valuable clues as to future direction - both short and long term. Daily volatility could also increase.
Wider trading ranges increase opportunities for traders. When it comes to volatility in the oil market, most traders will agree, the more the merrier.