Each Wednesday this article will be updated with the current seasonal study using CQG's Seasonal analysis applied to the Soybean, Wheat and Corn markets. You can download the CQG pac providing the… more
Each Wednesday this article will be updated with the current seasonal study using CQG's Seasonal analysis applied to the Soybean, Wheat and Corn markets. You can download the CQG pac providing the… more
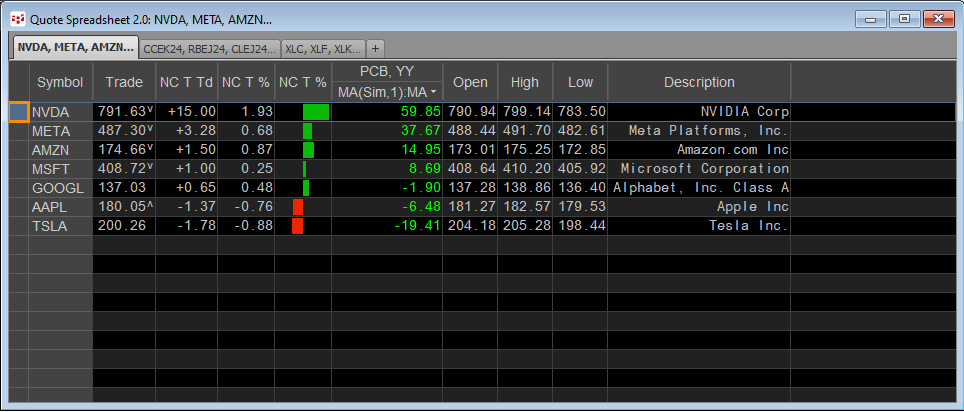
A popular form of market analysis is to maintain a real-time table of market performance based on an annualized basis. For example, the QSS 2.0 displayed below has a sorted column highlighted with… more
Each Wednesday this article will be updated with the current seasonal study using CQG's Seasonal analysis applied to the Soybean, Wheat and Corn markets. You can download the CQG pac providing the… more
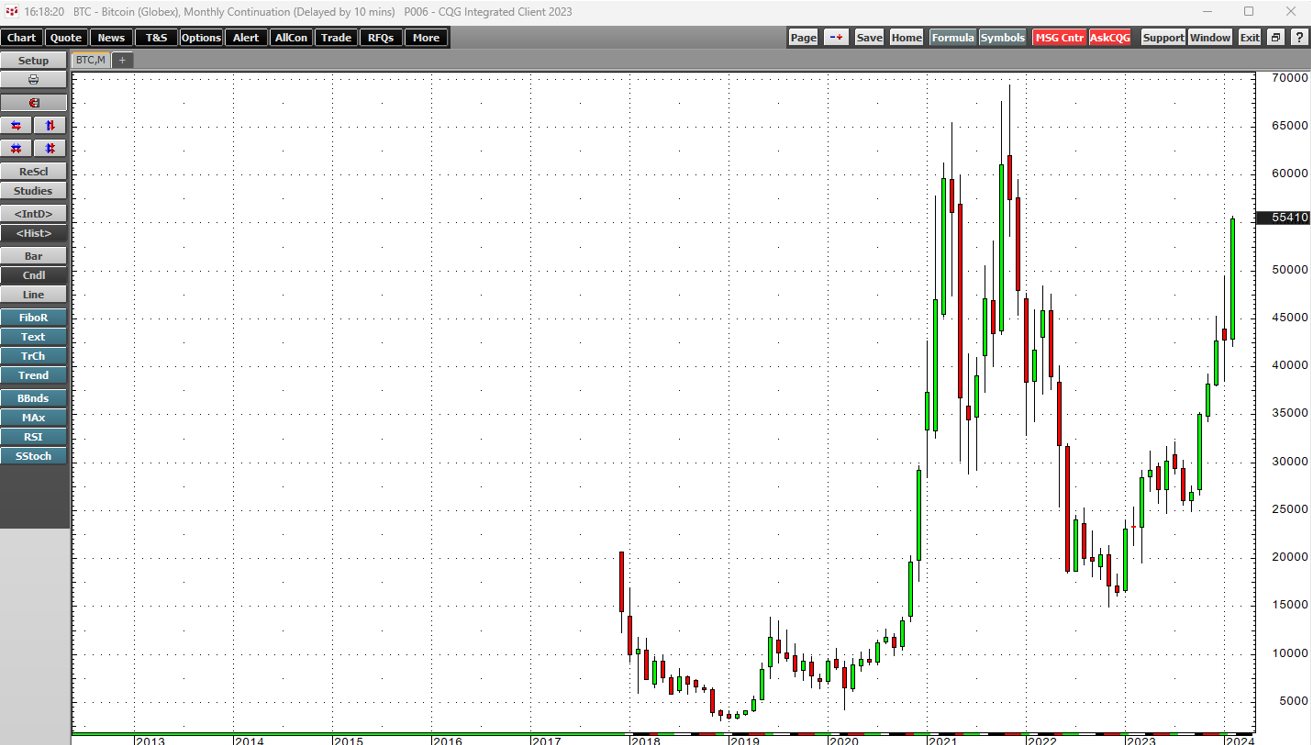
Gold has a long history as an alternative asset, while Bitcoin and digital currencies only burst on the scene starting in 2010. Gold has been a low-volatility asset over the past few years, in a… more
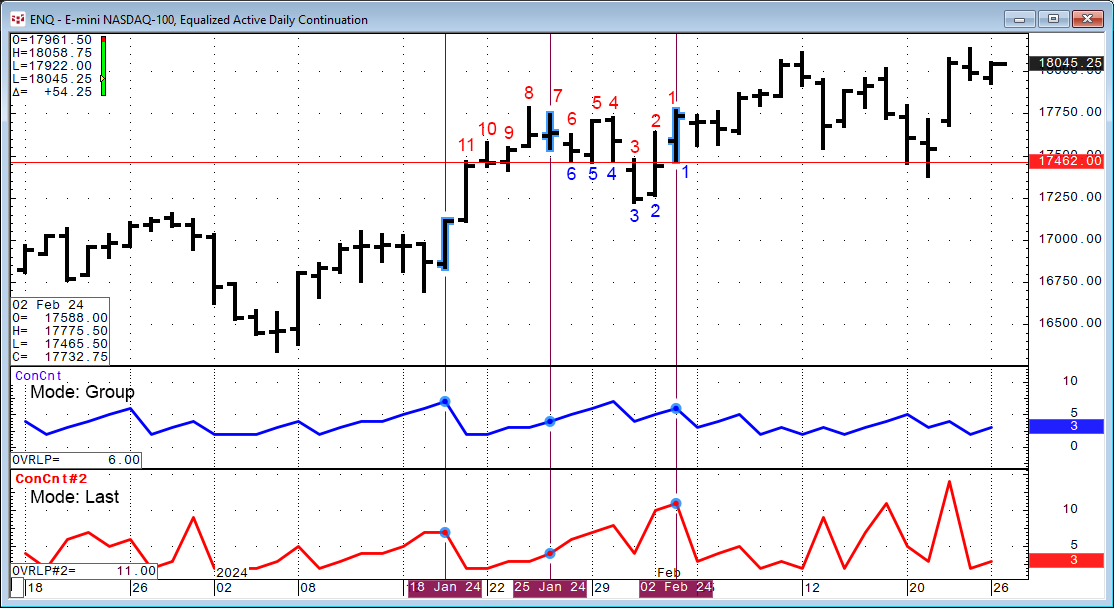
Markets tend to trend up, down, and sideways. Another name for trending sideways is congestion. A period of congestion is when the Open, High, Low, and Close price bars are overlapping. CQG IC and… more
Larry Mcdonald is a New York Times bestselling author, CNBC contributor, and Political Risk Expert. He is also the creator of The Bear Traps Report, a weekly independent Macro Research Platform… more
Judd Hirschberg is the Chief Global Strategist at WhiteWave Trading Strategies. He started as an Arbitrage Clerk on the CME in 1974, became a successful Proprietary Trader and has over 48 years of… more
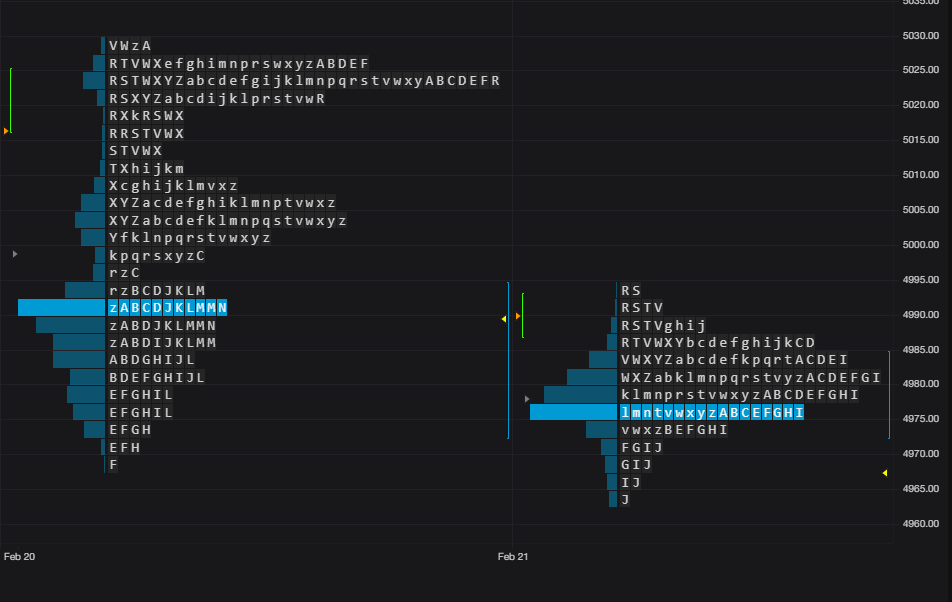
CQG One carries on the tradition of CQG product offerings with best-in-class market data visualization with the introduction in CQG One version 9.1.45025 the CQG Profile chart type and the CP… more
Each Wednesday this article will be updated with the current seasonal study using CQG's Seasonal analysis applied to the Soybean, Wheat and Corn markets. You can download the CQG pac providing the… more
