CQG One carries on the tradition of CQG product offerings with best-in-class market data visualization with the introduction in CQG One version 9.1.45025 the CQG Profile chart type and the CP study.
First, an introduction to Market Profile.
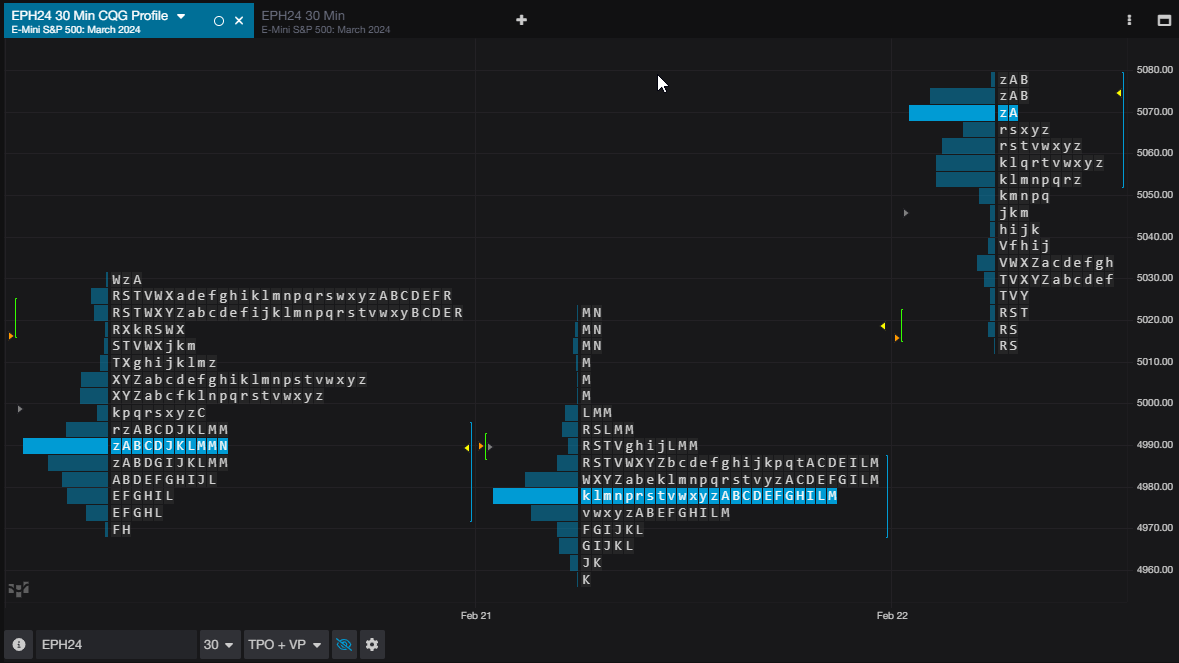
CQG Profile charts display price distributions, which are constructed of TPOs (Time/Price Opportunities). Each TPO letter identifies a time when the market traded at the price indicated on the vertical axis. Volume profiles are also displayed. They are horizontal bar graphs that appear to the left of each Market Profile distribution. Professional traders use Market Profile charts to identify value, price acceptance, and price rejection. For more information regarding Profile charts, please review the Help file.
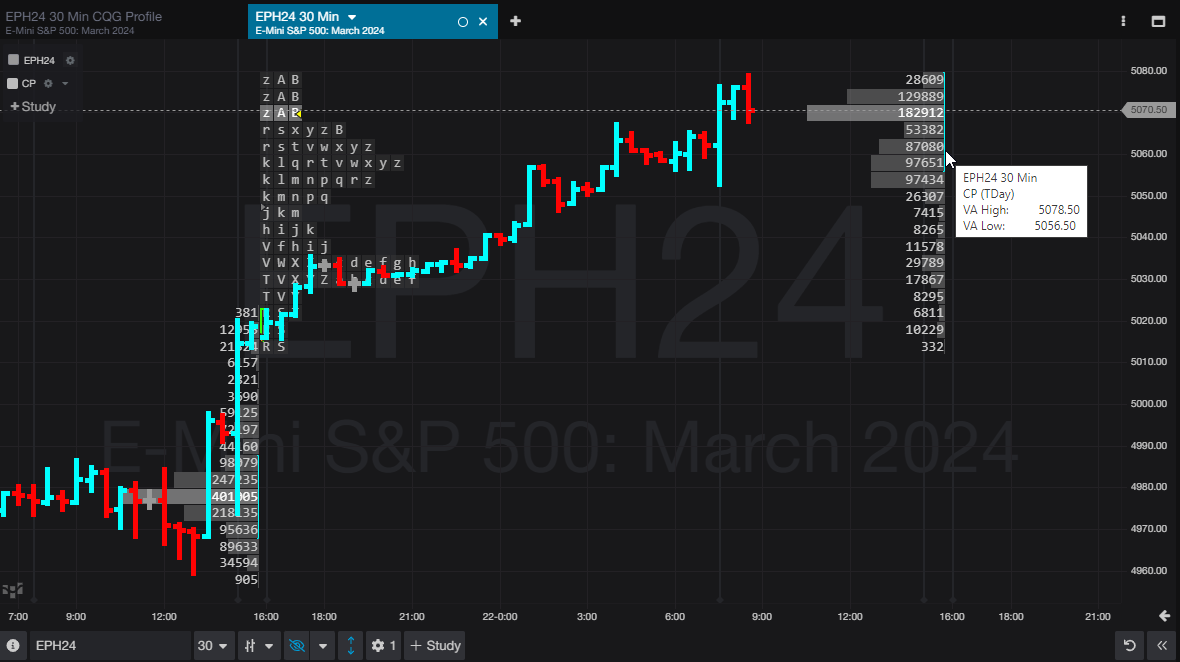
With CQG Profile charts you have access to the CP study. This study overlays on a chart, such as the bar chart, the same TPOs price distributions. In addition, the Volume Profile chart can be displayed. The CP Study highlights the Value Area, which identifies the range in which 70% of each contract’s actual volume occurred. In addition, Point of Control (POC), Initial balance, Initial balance range, Open Price Marker, Mid-price marker and Current Price Marker can be displayed.
Signup for a free trial of CQG One.
Requires CQG One Version 9.1.45025 or higher.