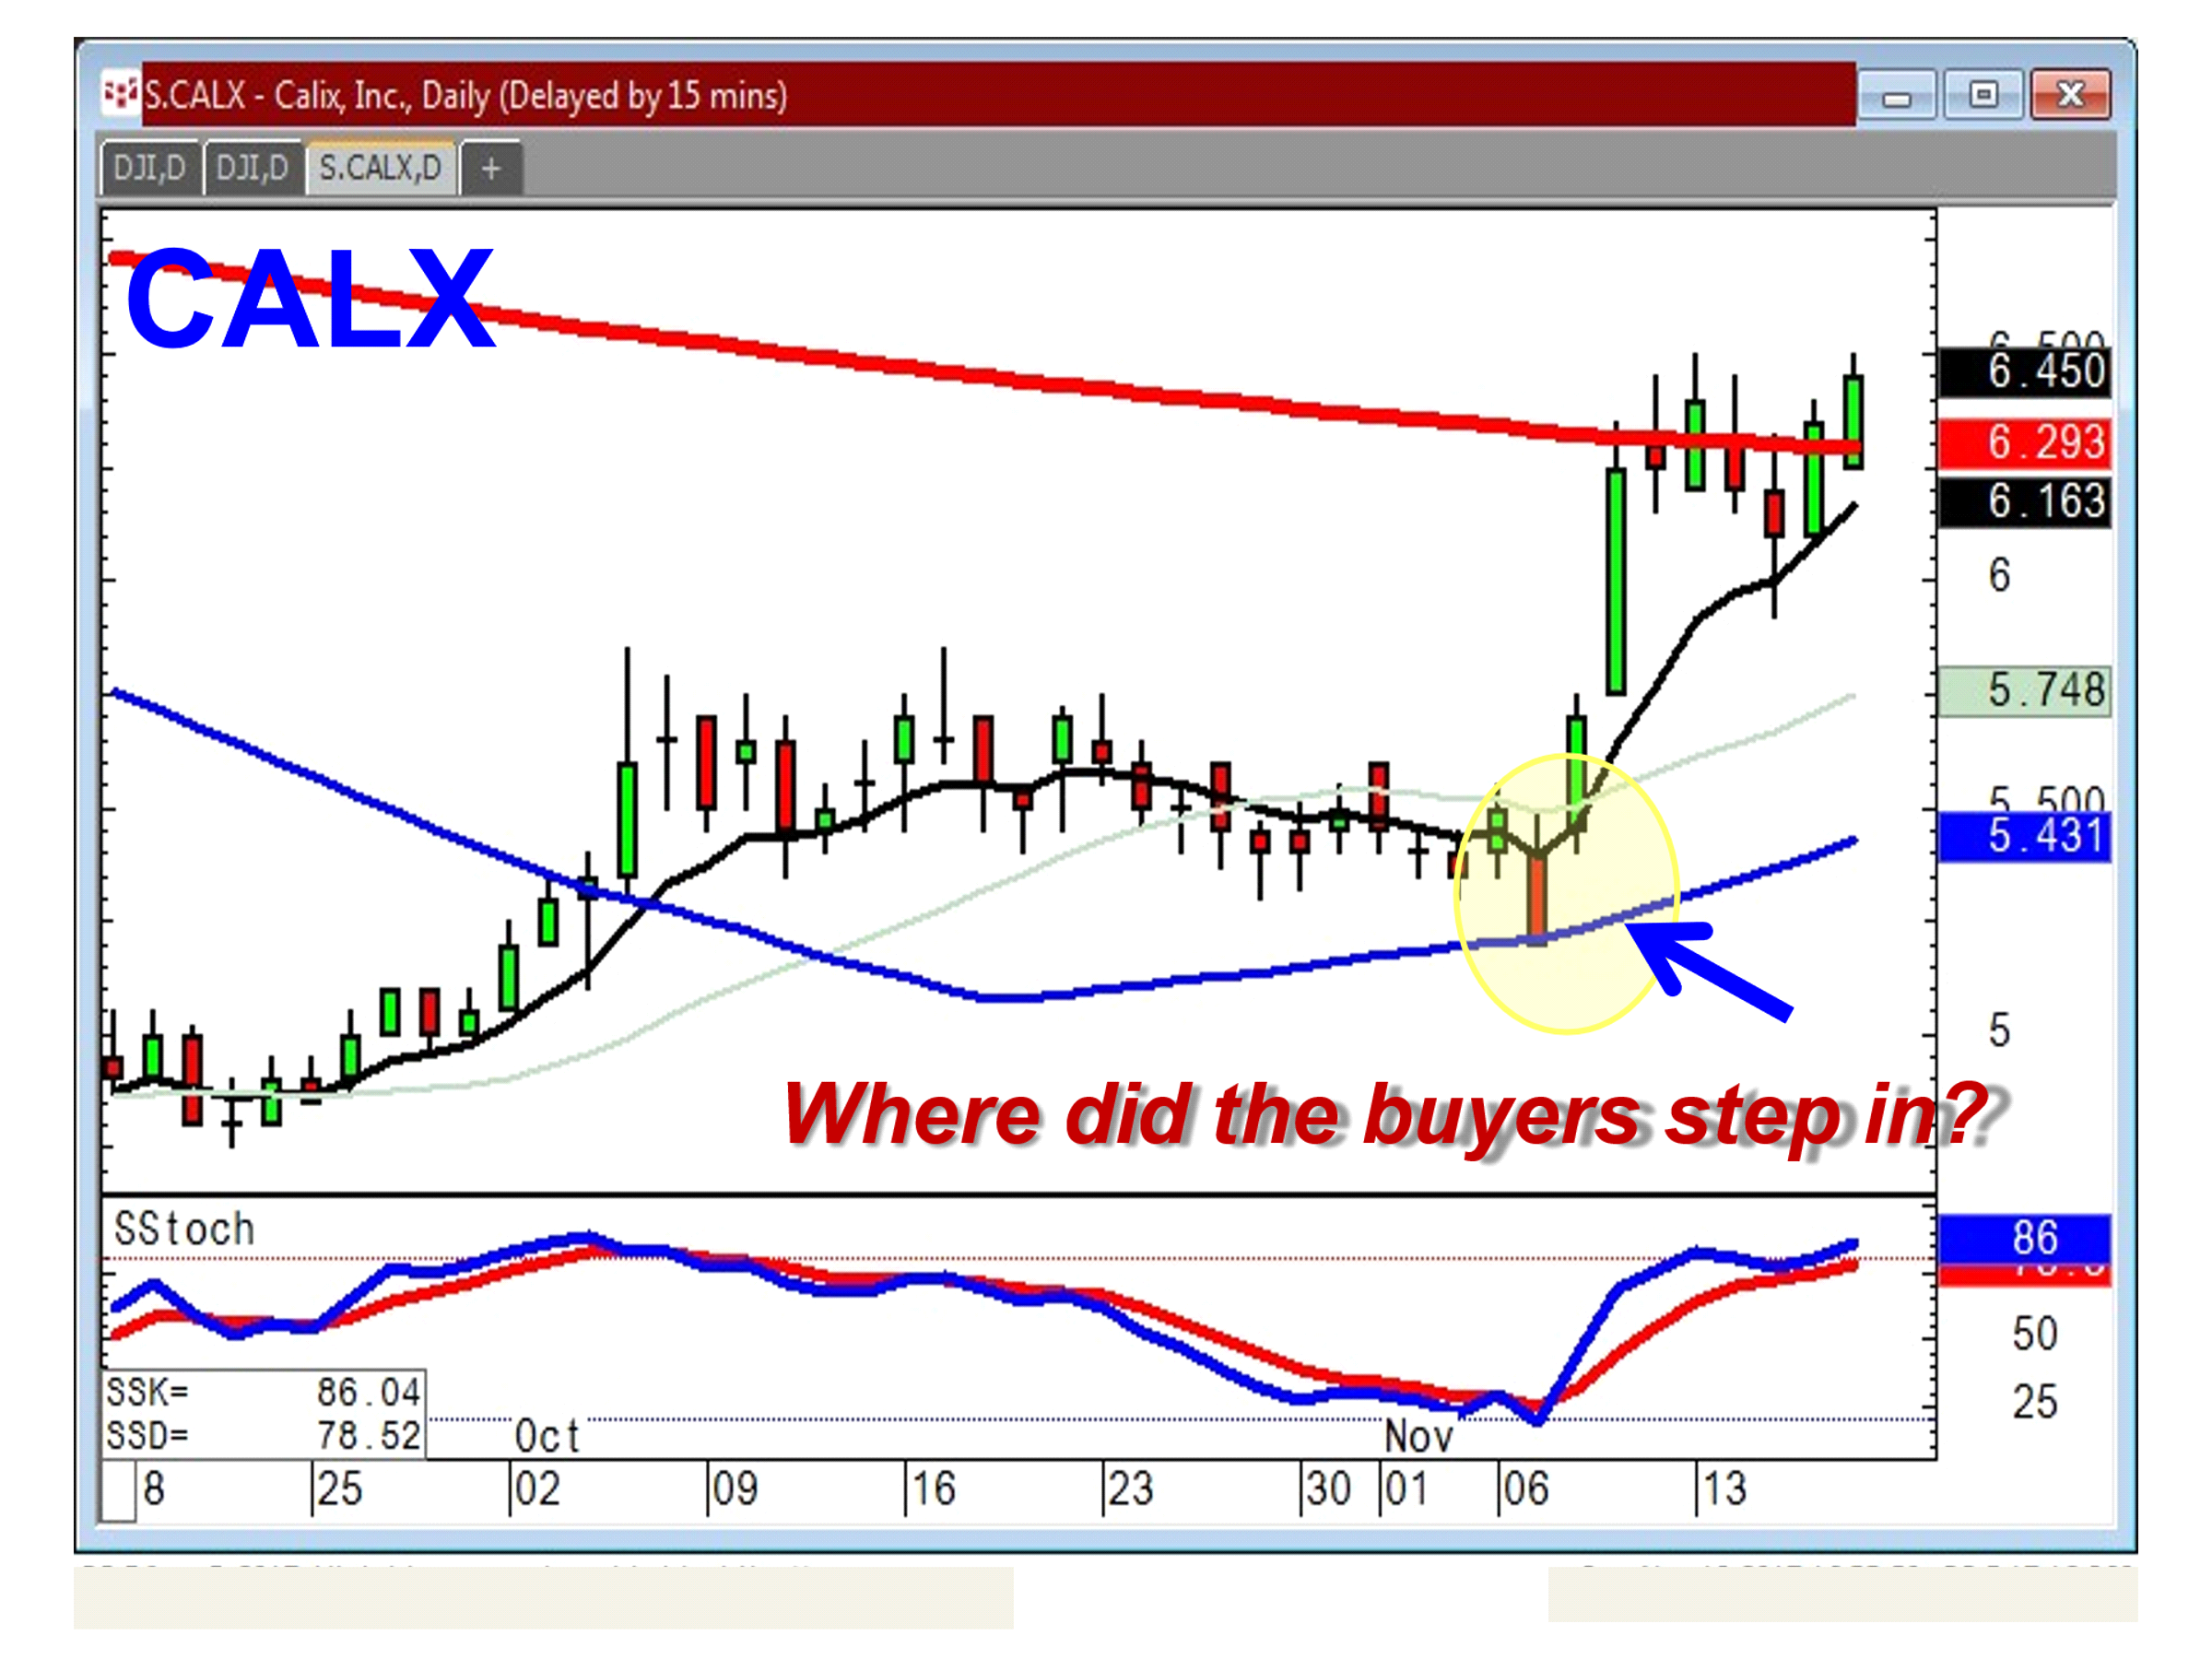
What are the most potent candlestick signals? This is the question many investors ask when just learning about candlestick analysis. There are approximately 50 or 60 candlestick signals. But there… more
Larry Hite famously posited the 1% rule in Schwager's, "Market Wizards". This risk management rule suggests risking no more than 100 basis points of total assets under management on any… more
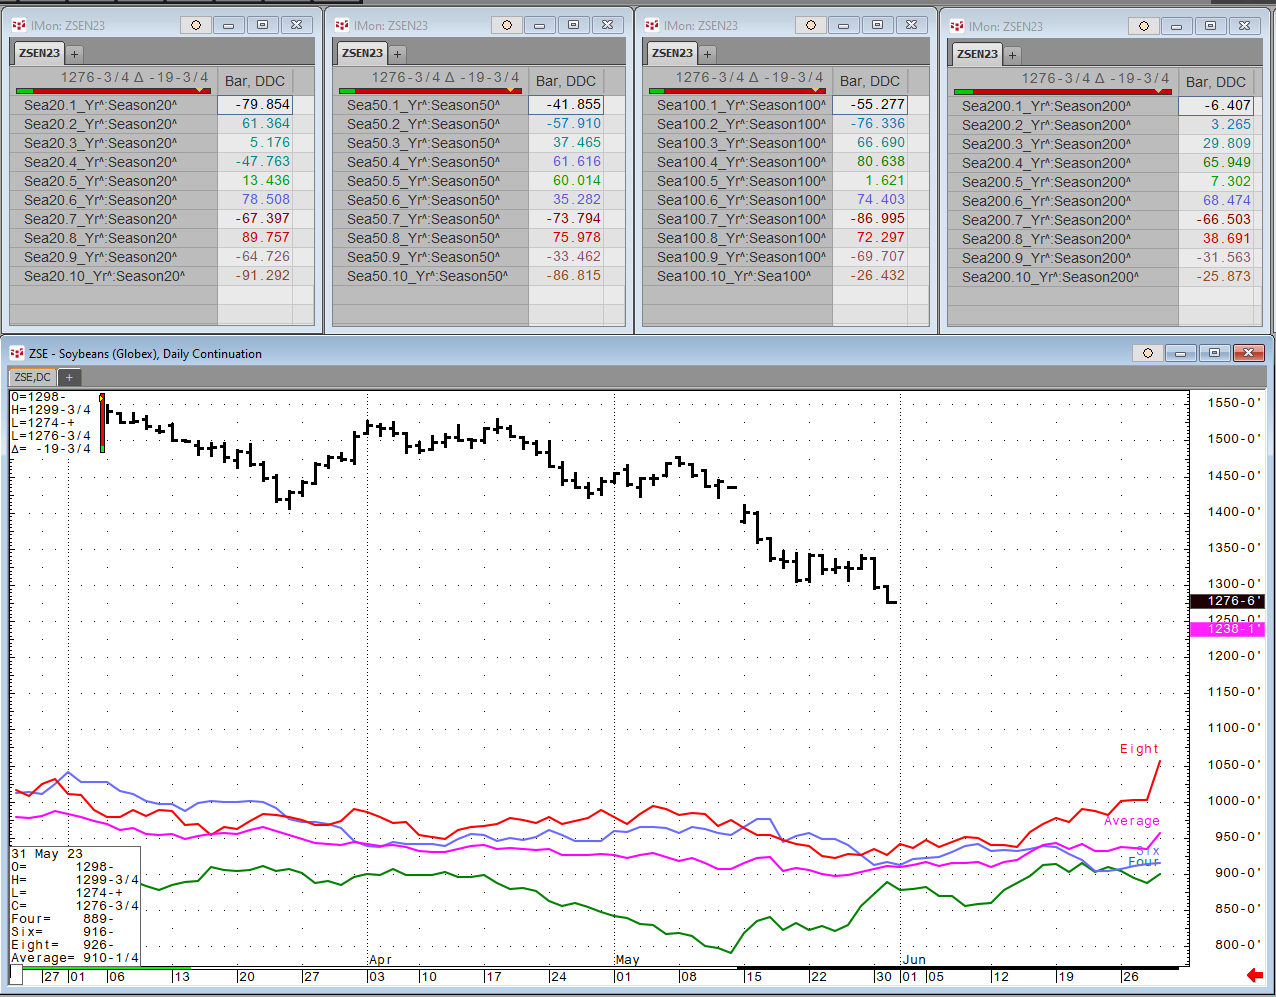
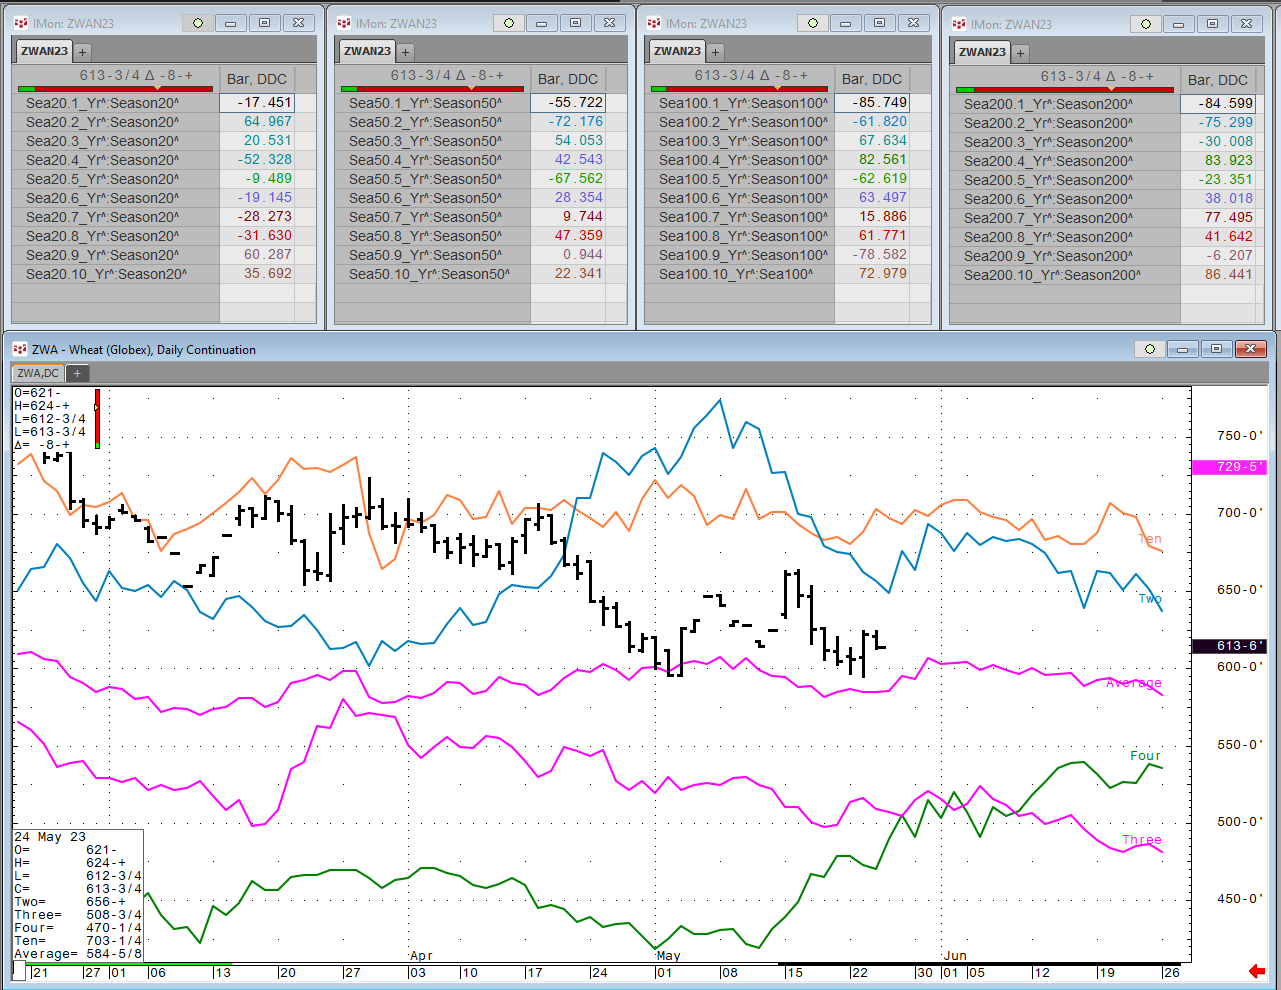
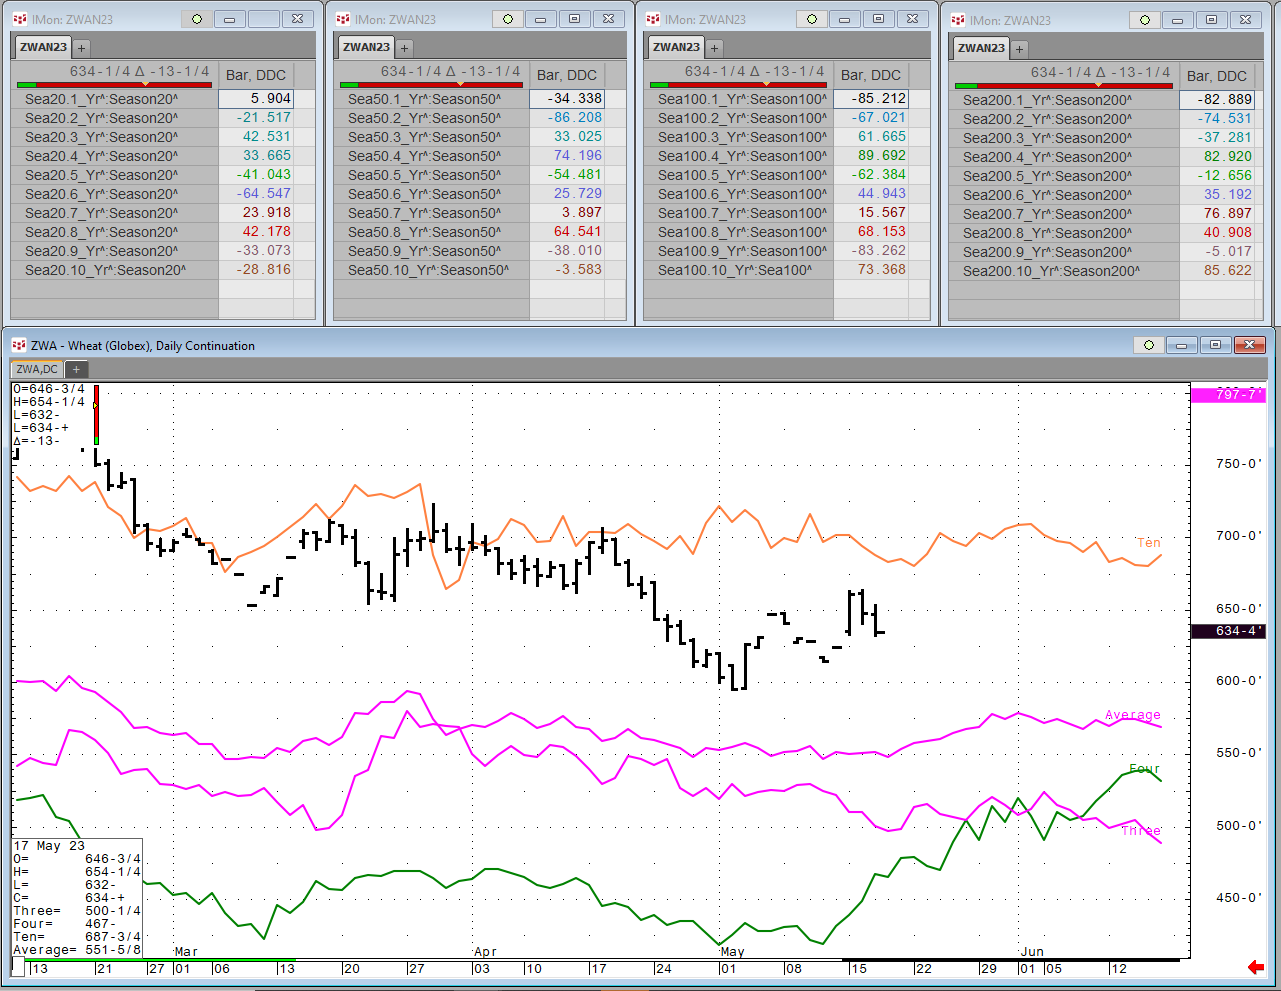
Each Wednesday this article will be updated with the current seasonal study using CQG's Seasonal analysis applied to the Soybean, Wheat and Corn markets. You can download the CQG pac providing the… more
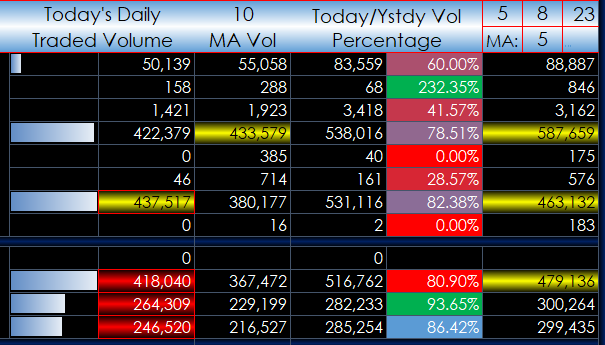
This Microsoft Excel® dashboard displays all of the ICE-traded Three-Month SONIA contracts including volume and open interest data.
The first three columns detail the contract month… more
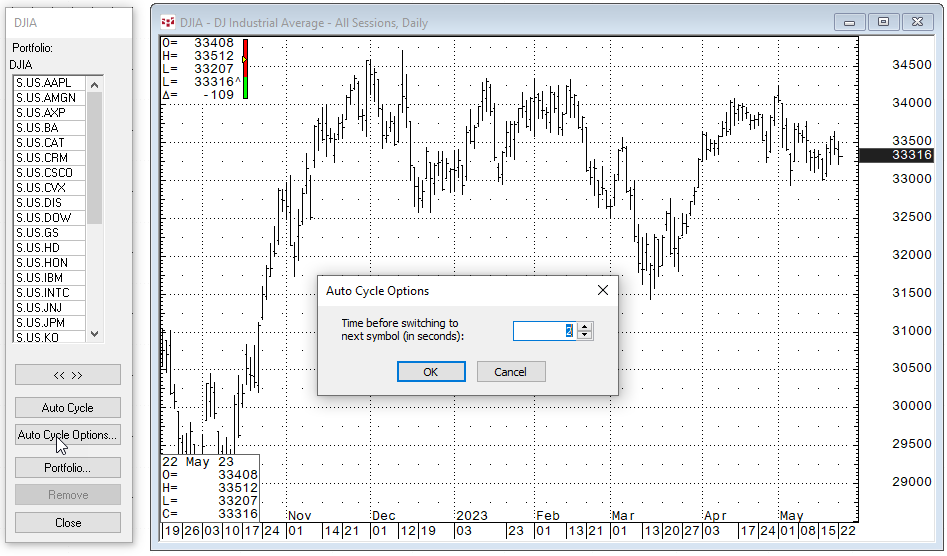
CQG IC and QTrader have a portfolio manager that enables you to create a portfolio of instruments. Once a portfolio is created a common use is for CQG IC users to run a Market Scan testing various… more
Each Wednesday this article will be updated with the current seasonal study using CQG's Seasonal analysis applied to the Soybean, Wheat and Corn markets. You can download the CQG pac providing the… more
This Microsoft Excel® dashboard displays all of the Globex-traded Three-Month SOFR contracts including volume and open interest data.
The first three columns detail the contract… more
Each Wednesday this article will be updated with the current seasonal study using CQG's Seasonal analysis applied to the Soybean, Wheat and Corn markets. You can download the CQG pac providing the… more
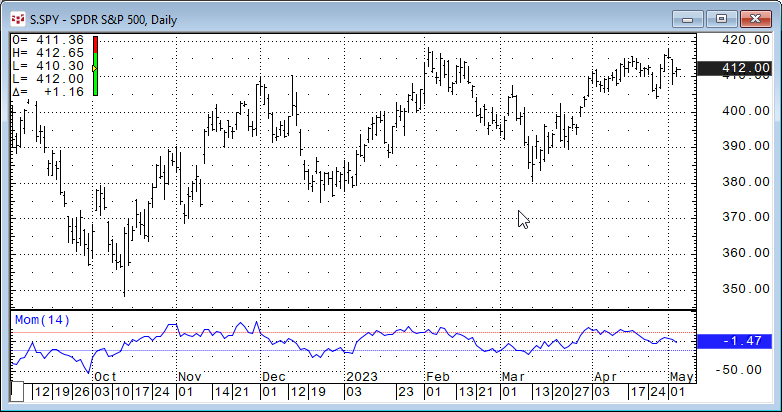
Oscillators are very popular studies used by traders and analysts alike. Oscillators detrend the price data by calculating differences. The next image displays a simple oscillator named Momentum.… more
