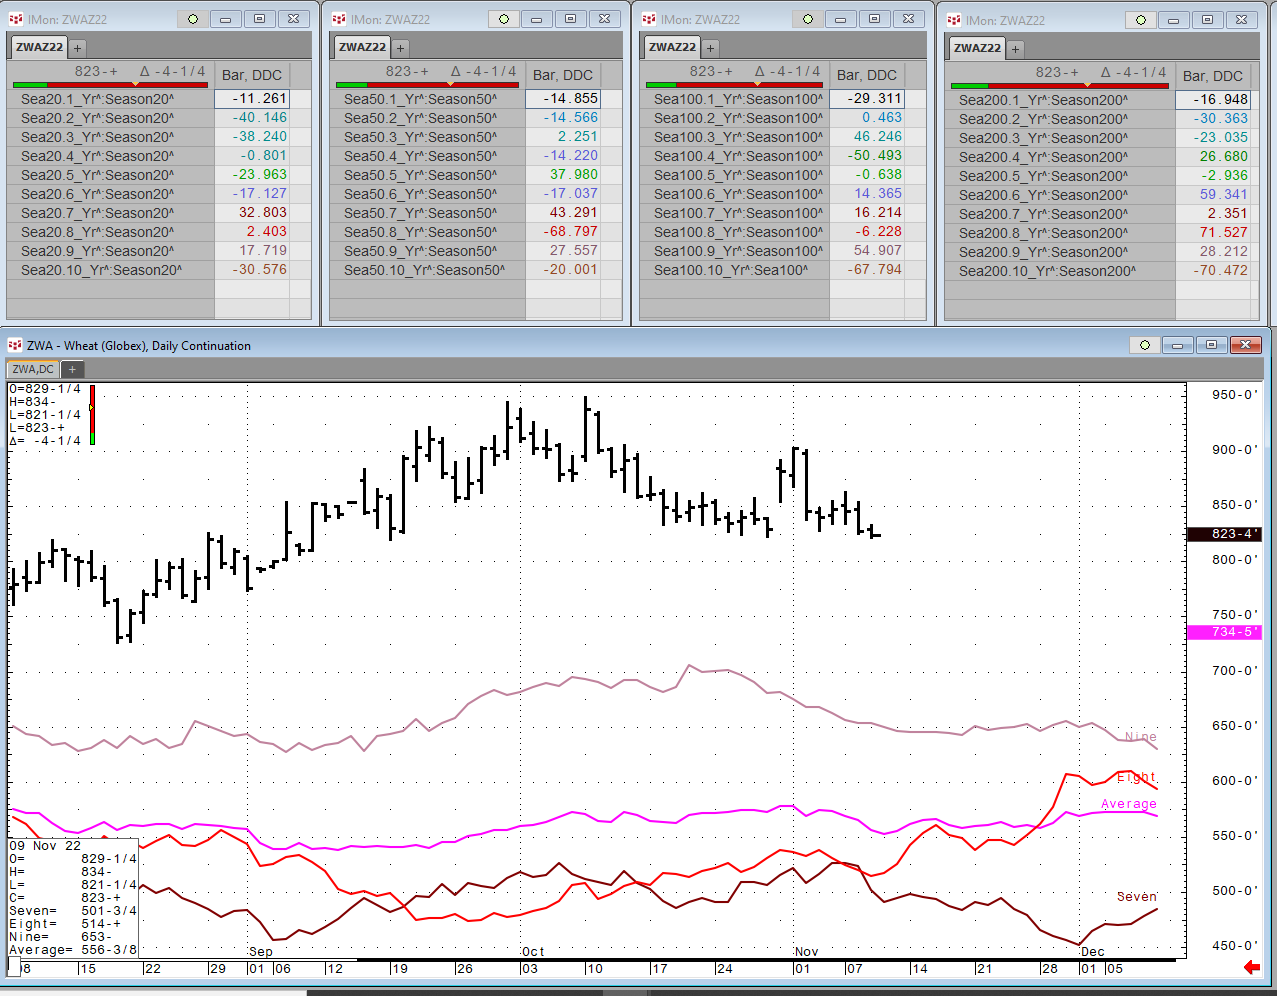
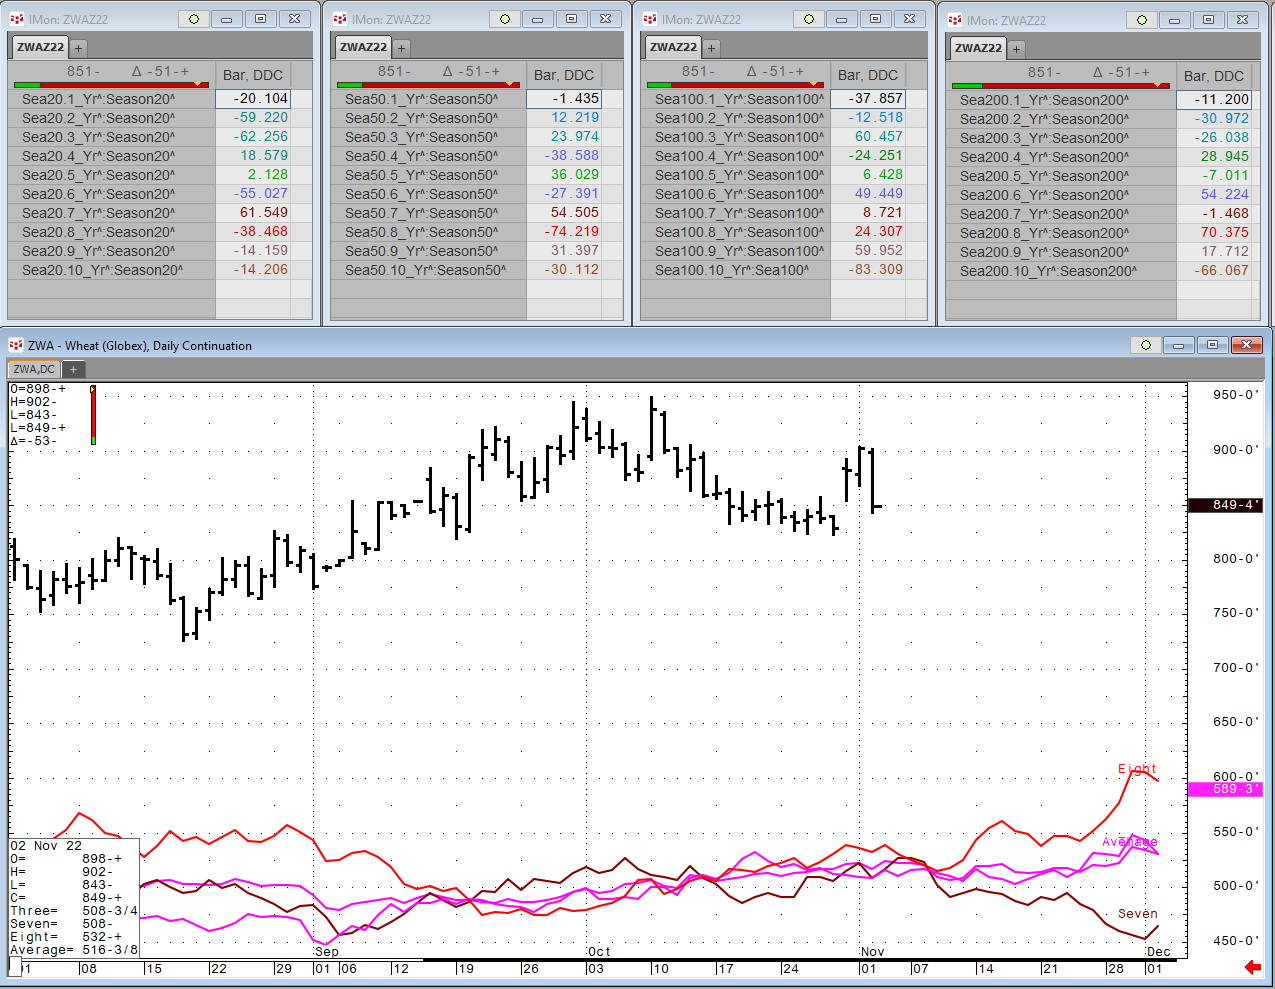
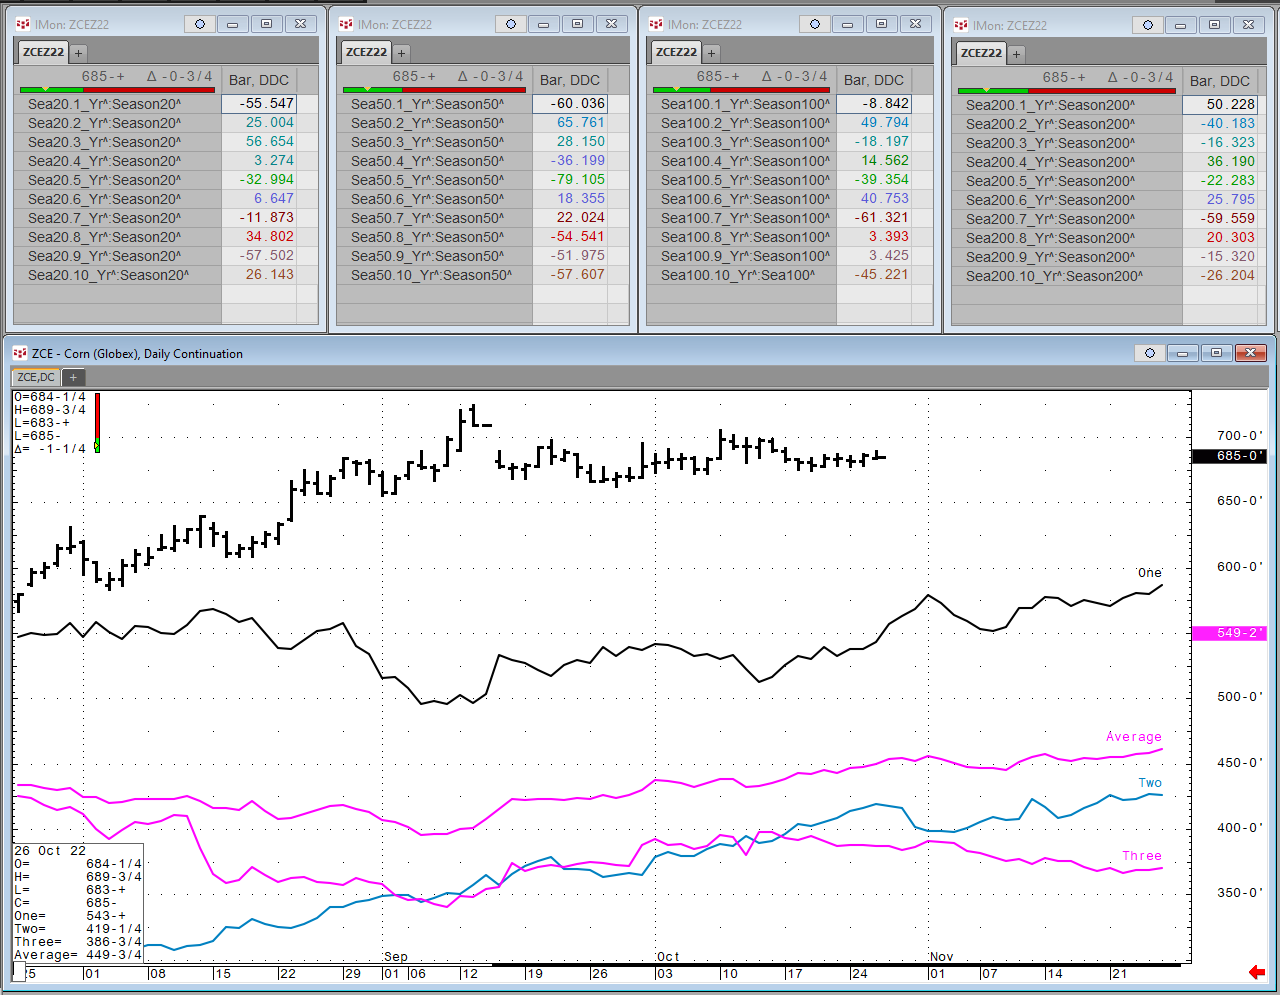
Each Wednesday this article will be updated with the current seasonal study using CQG’s Seasonal analysis applied to the Soybean, Wheat and Corn markets. You can download the CQG pac providing the… more
Each Wednesday this article will be updated with the current seasonal study using CQG’s Seasonal analysis applied to the Soybean, Wheat and Corn markets. You can download the CQG pac providing the… more
On November 2, the US Fed did precisely what the market had expected and increased the Fed Funds Rate by 75 basis points for the fourth consecutive time. In March 2022, the Fed Funds Rate was at… more
Each Wednesday this article will be updated with the current seasonal study using CQG’s Seasonal analysis applied to the Soybean, Wheat and Corn markets. You can download the CQG pac providing the… more
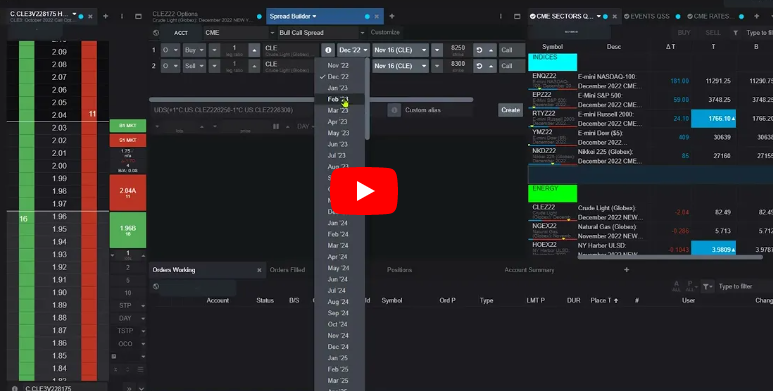
CQG One, the next generation flagship trading and data visualization product for the financial markets now offers the Spread Builder and User Defined Strategies (UDS).
Watch this video to… more
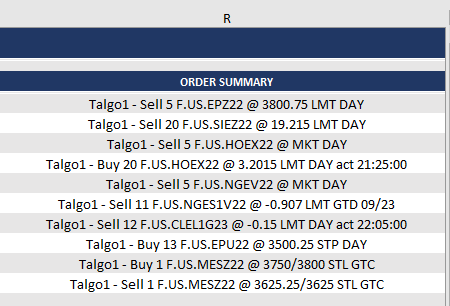
Here, we introduce placing Batch Orders using the CQG XL Toolkit. At the bottom of the post is a downloadable Excel sample. For more details there are two links to the CQG IC/QTrader Help files… more
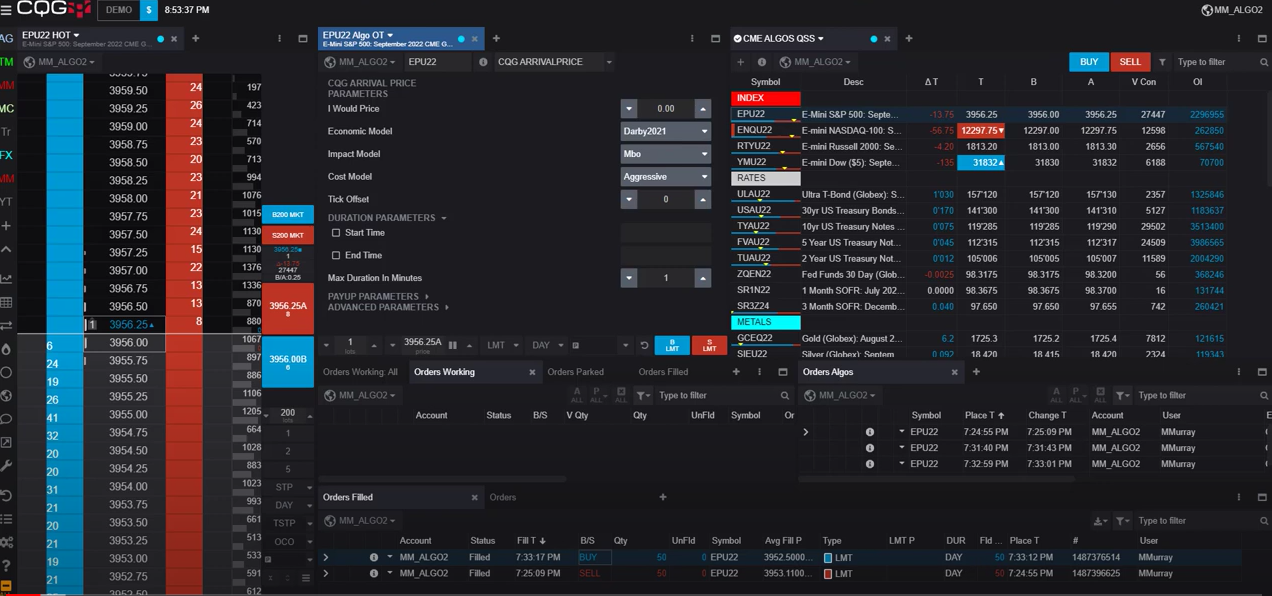
CQG One, the next generation flagship trading and data visualization product for the financial markets now offers access to CQG Algos.
Watch this video to learn about using CQG Algos to… more
Each Wednesday this article will be updated with the current seasonal study using CQG’s Seasonal analysis applied to the Soybean, Wheat and Corn markets. You can download the CQG pac providing the… more
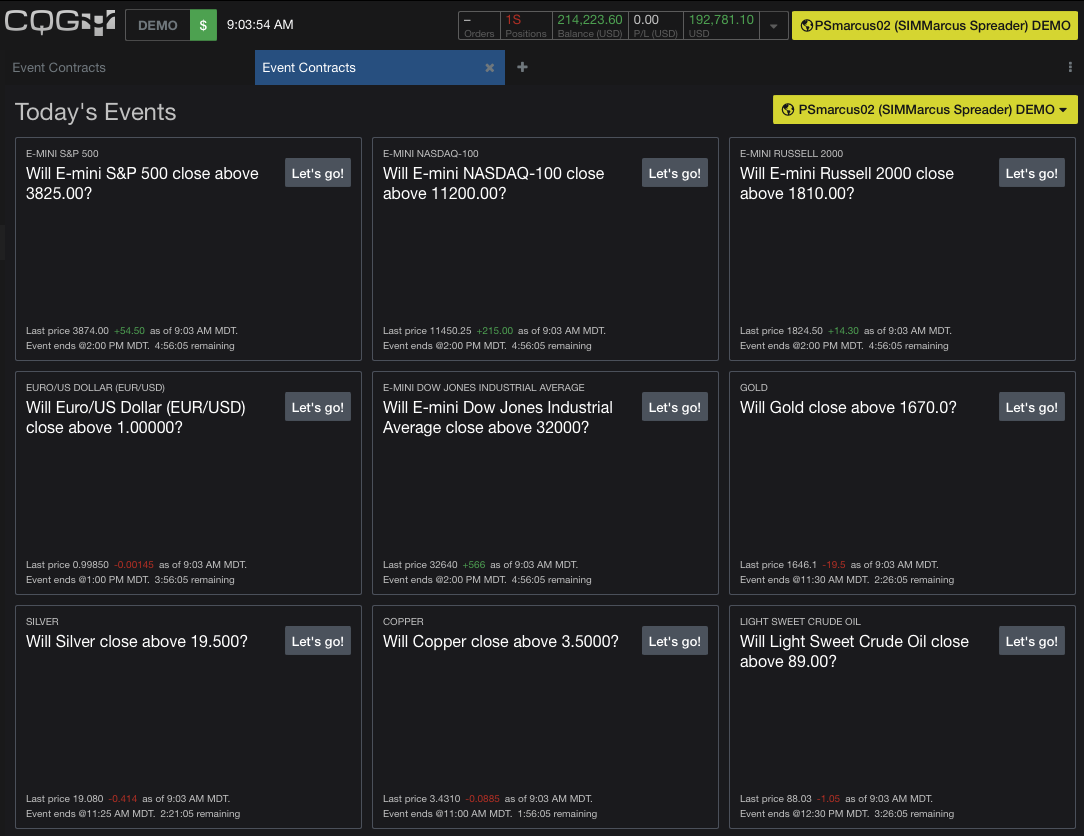
CME Group launches event contracts that enable traders to express their view on whether the price of key futures markets will move up or down by the end of each day's trading session, including… more
