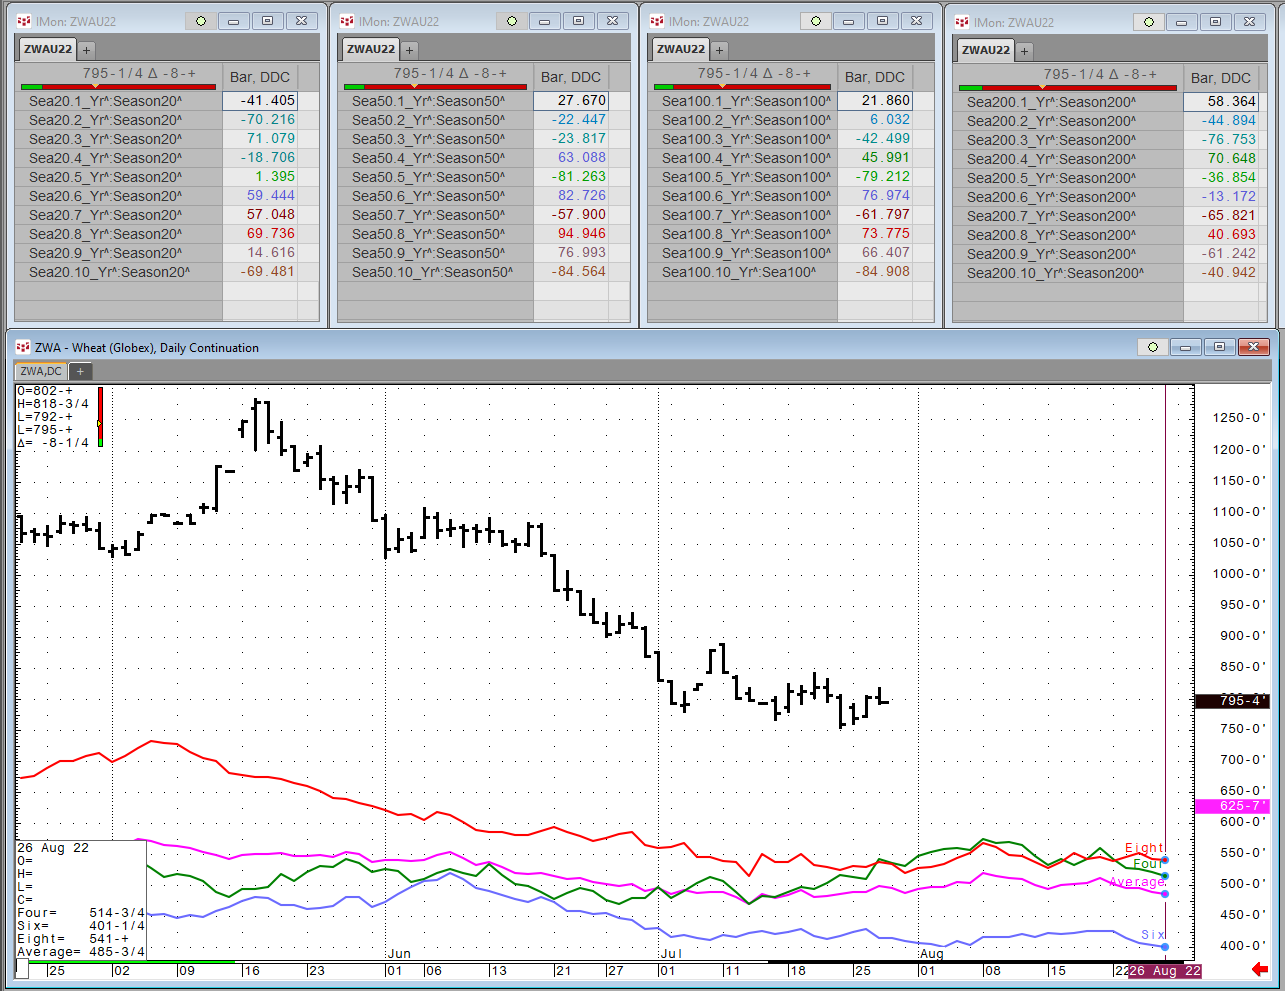
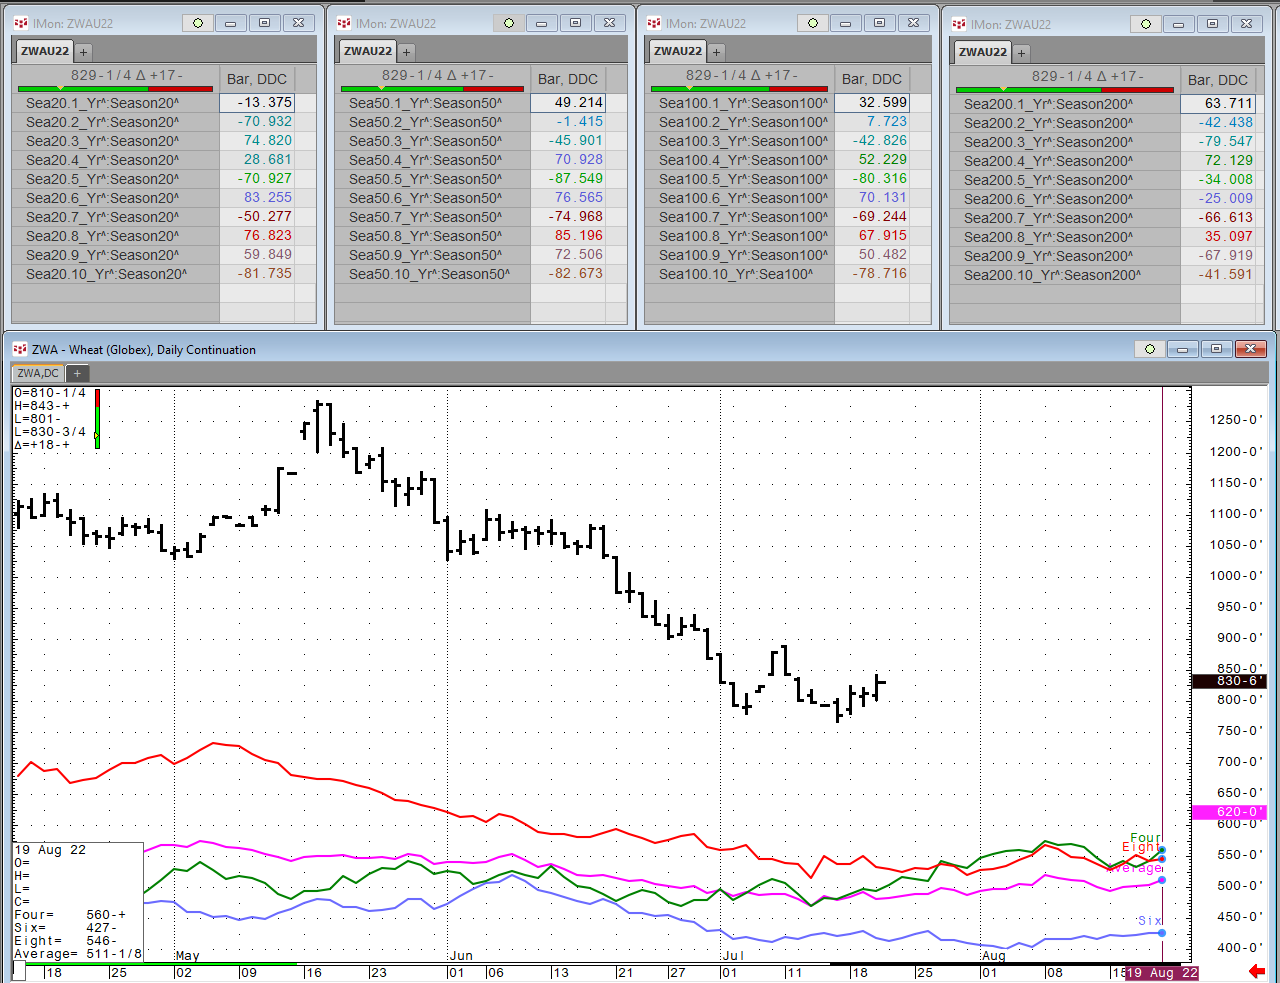
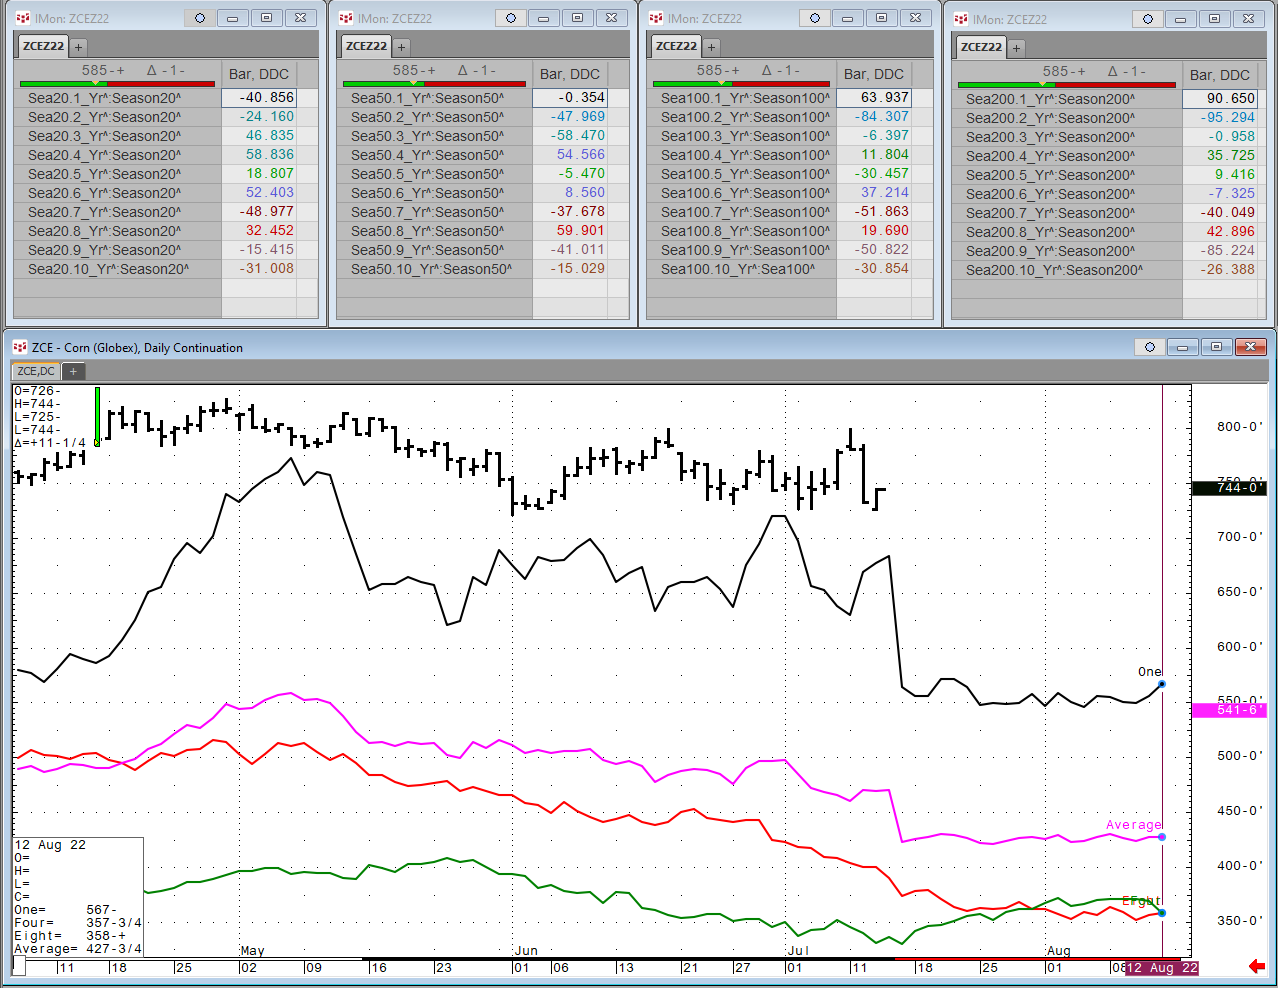
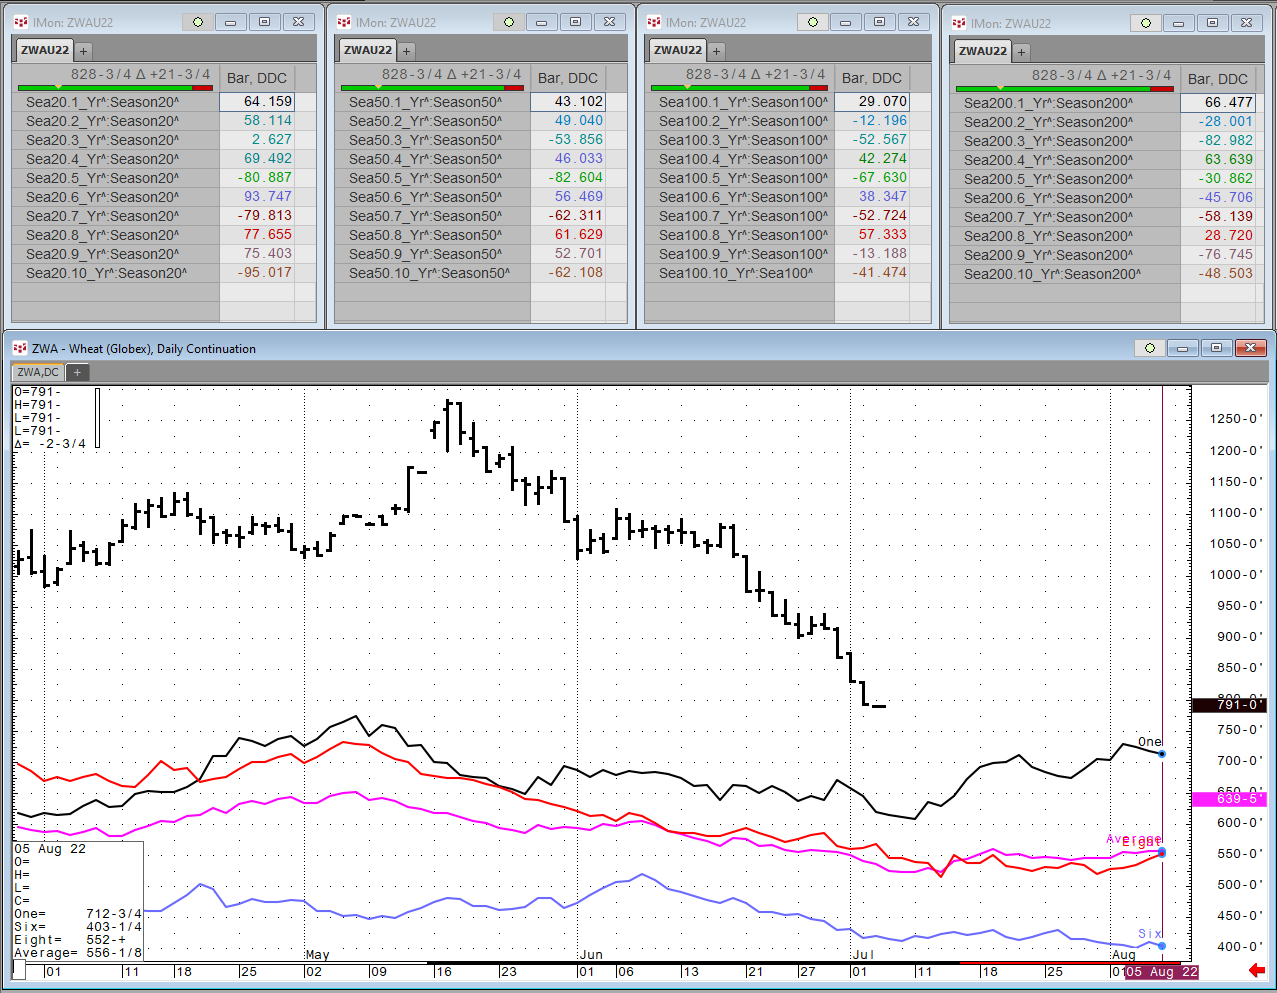
Each Wednesday this article will be updated with the current seasonal study using CQG’s Seasonal analysis applied to the Soybean, Wheat and Corn markets. You can download the CQG pac providing the… more
Frank Shostak is an Associated Scholar of the Mises Institute. His consulting firm, Applied Austrian School Economics, provides in-depth assessments and reports of financial… more
Each Wednesday this article will be updated with the current seasonal study using CQG’s Seasonal analysis applied to the Soybean, Wheat and Corn markets. You can download the CQG pac providing the… more
Each Wednesday this article will be updated with the current seasonal study using CQG’s Seasonal analysis applied to the Soybean, Wheat and Corn markets. You can download the CQG pac providing the… more
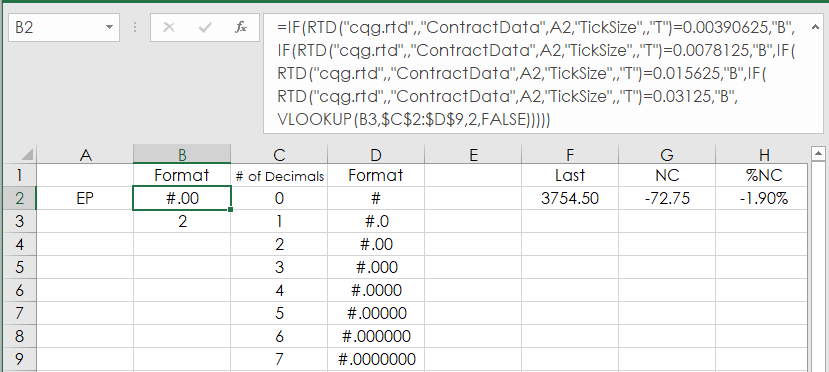
When using RTD functions in Excel to pull in market prices you have to manually format the prices. Excel does not know that the E-mini S&P 500 price has two decimals places (i.e. 3909.25) and… more
Each Wednesday this article will be updated with the current seasonal study using CQG’s Seasonal analysis applied to the Soybean, Wheat and Corn markets. You can download the CQG pac providing the… more
In July 2022 CQG Product Specialist Helmut Mueller updated his Super Template, which is a sample trading system ready to run that has a long and short entry, and many programmed different exits.… more
In July 2022 CQG Product Specialist Helmut Mueller updated his Super Template, which is a sample trading system ready to run that has a long and short entry, and many programmed different exits.… more
After renewing the Super template in July 2022 I also created a set of trading systems based on very commonly used indicators. The exits are summarized at the end.
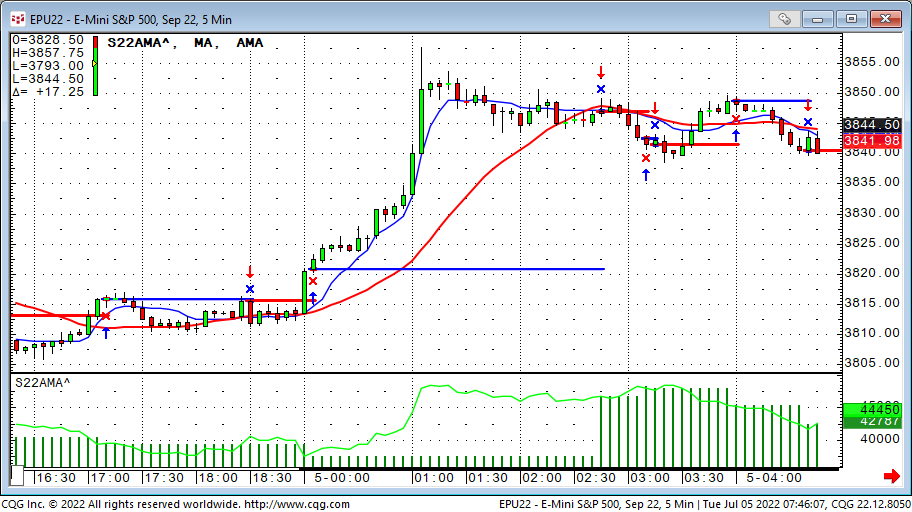
1. AMA trading system… more
