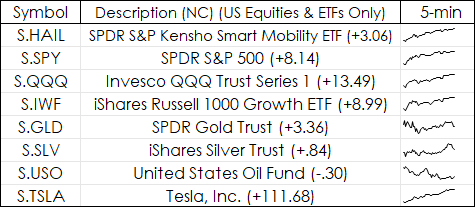
Sparklines have been available beginning with Microsoft® Excel 2010. A Sparkline is a simple chart that is displayed within a cell or a group of merged cells. Sparklines are a nice addition to a quote display as the quote display shows current values, such as last price and net change, the Sparkline chart can show price action. While any time frame can be used, for this article the Sparkline will display a 5-minute close chart for today’s session.
To plot these Sparklines in Excel the CQG Barix (Bar Index) function is used within the RTD formula.
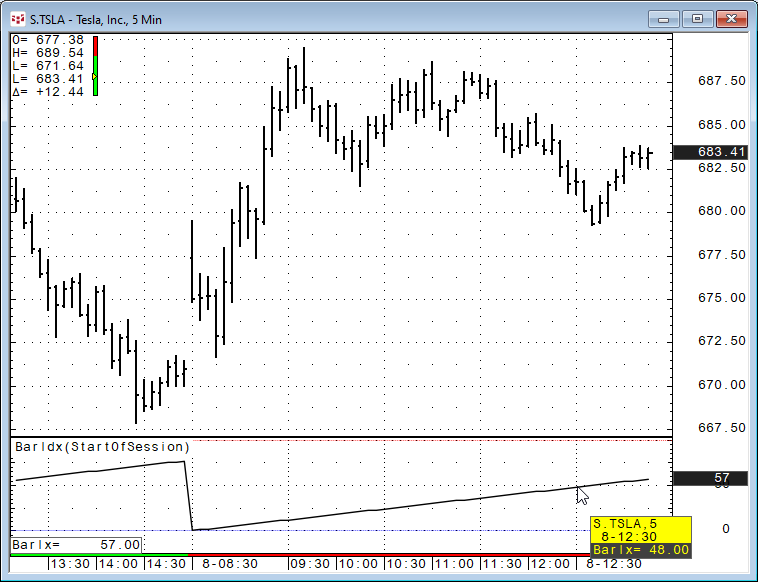
The Bar Index Function is a count of the number of bars in the session based on the time frame. For a stock there are 77 5-minute bars in the trading session. The function offer a choice of four reference points for the counting:
- Start of Day = number of bars since the start of trading day
- End of Day = number of bars left in trading day
- Start of Session = number of bars since start of session
- End of Session = number of bars left in session
The RTD formula below returns the close of the 5-minute bar using Barix function from the “Start of the Session” for the tenth (10) bar.
=RTD("cqg.rtd",,"StudyData", "Close(S.QQQ) When Barix(S.QQQ,reference:=StartOfSession)=10", "Bar", "", "Close","5","0","All",,,"False","T","EveryTick")The RTD formulas using Bar Index have a unique feature and that is if the trading session has not reached a particular bar count it will pull the close using the same count number from the previous session, which we don’t want.
This image below is from the data tab. Column A is the count for the Barix function used in columns E through K. 0 is for the close of the first 5-minute bar, 1 is for the close of the second 5-minute bar, up to the 77th 5-minute bar.
Column B is the time of each 5-minute bar. These values are fixed and simply pasted into column B. In cell D1 Excel is checking that today is not a weekend day.
=IF(OR(WEEKDAY(TODAY())=1,WEEKDAY(TODAY())=7),0,1)
The formula above returns 0 if it is the weekend. This is used because on Saturday or Sunday the RTD formulas would pull Friday’s data.
Cell C2 is the current “Line Time” from this RTD formula. The Excel MOD function is used to divide the RTD retuned value by 1 and it returns just the time and not the combination of date and time:
=MOD(RTD("cqg.rtd", ,"SystemInfo", "Linetime"),1)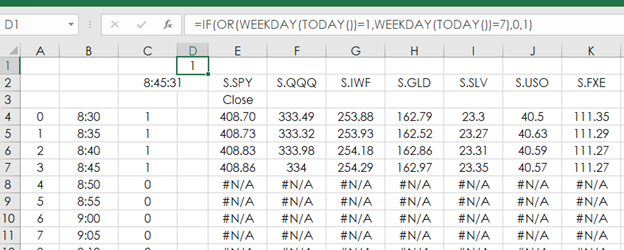
Cell C4 is checking that Today is a Weekday (from D1) and the current time (Cell C2) is more than the time of the bar time in column B. If both are true a 1 is returned.
=IF($D$1=0,1,IF($C$2>B4,1,0))
For the close of each symbol on a 5-minite basis this RTD Formula is used:
=IF(C4=0,NA(),RTD("cqg.rtd",,"StudyData", "Close("&$E$2&") When Barix("&$E$2&",reference:=StartOfSession)="&A4&"", "Bar", "", "Close","5","0","All",,,"False","T","EveryTick"))
Notice above that if the value in column C is a “0” then the error NA() is returned (#N/A). An Excel chart will skip the #N/A error.
To add a Sparkline chart to a cell click on the Insert tab and then the Sparkline icon.
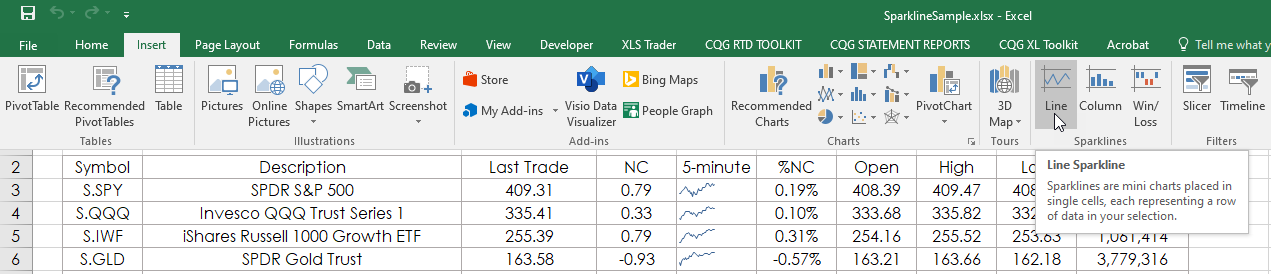
And, select the cell location and the range of the data series to be displayed.
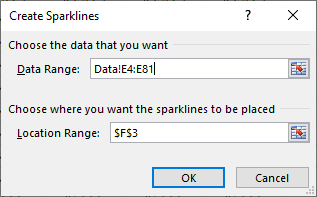
You can merge cells to draw a larger Sparkline chart.
Once you have added the Sparkline select the cell and then “Design” to modify the chart.
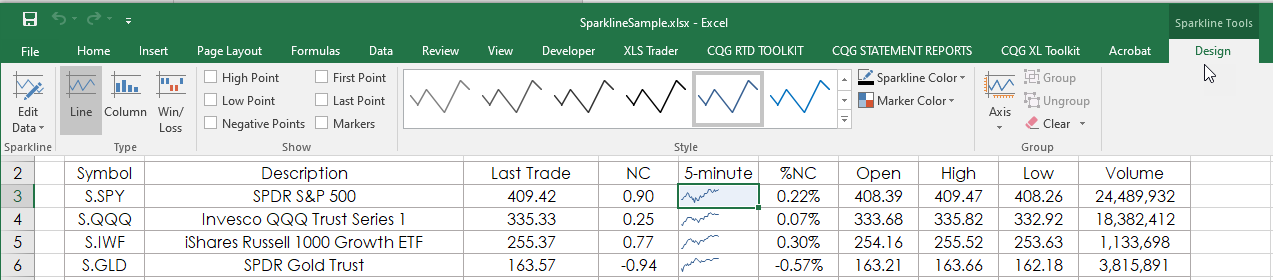
The downloadable Excel sample has a Main Display tab and the Data tab uses the symbols from the Main Display.

Sparklines are an efficient use of space in your Excel Quote displays. A quick glance gives you a clear idea of how a market has been performing.
Requires CQG Integrated Client 20 or higher or QTrader 20 or higher. Strongly recommended: Microsoft Office Professional Excel 2016, 2019, 32 or 64-bits installed on your computer, not in the Cloud.