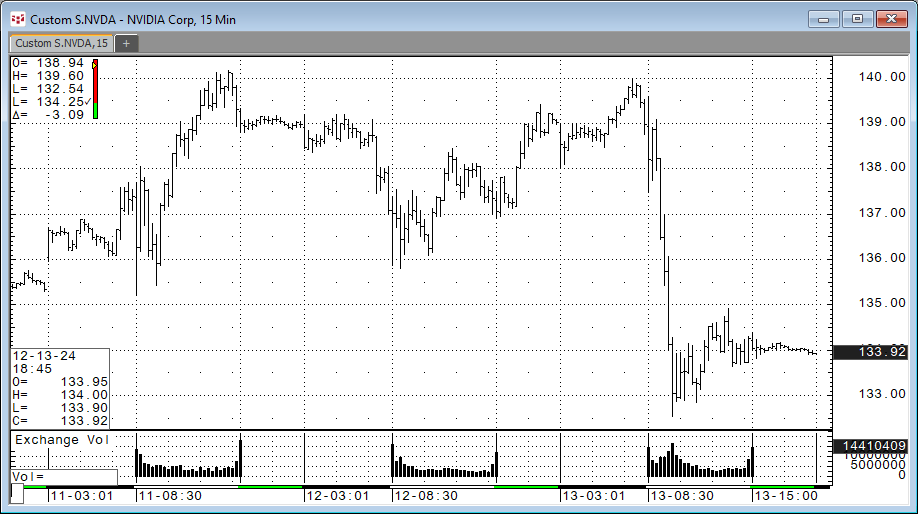
Recent posts detailed observing market data during pre-, current, and post-market sessions. The post View Pre and Post Sessions for Stocks detailed the steps to displaying a chart that included Pre-, Current, and Post-sessions using bid and asks for building the bar data during the Pre- and Post-sessions. A downloadable CQG PAC was included that added a CQG page with four charts and the custom sessions.
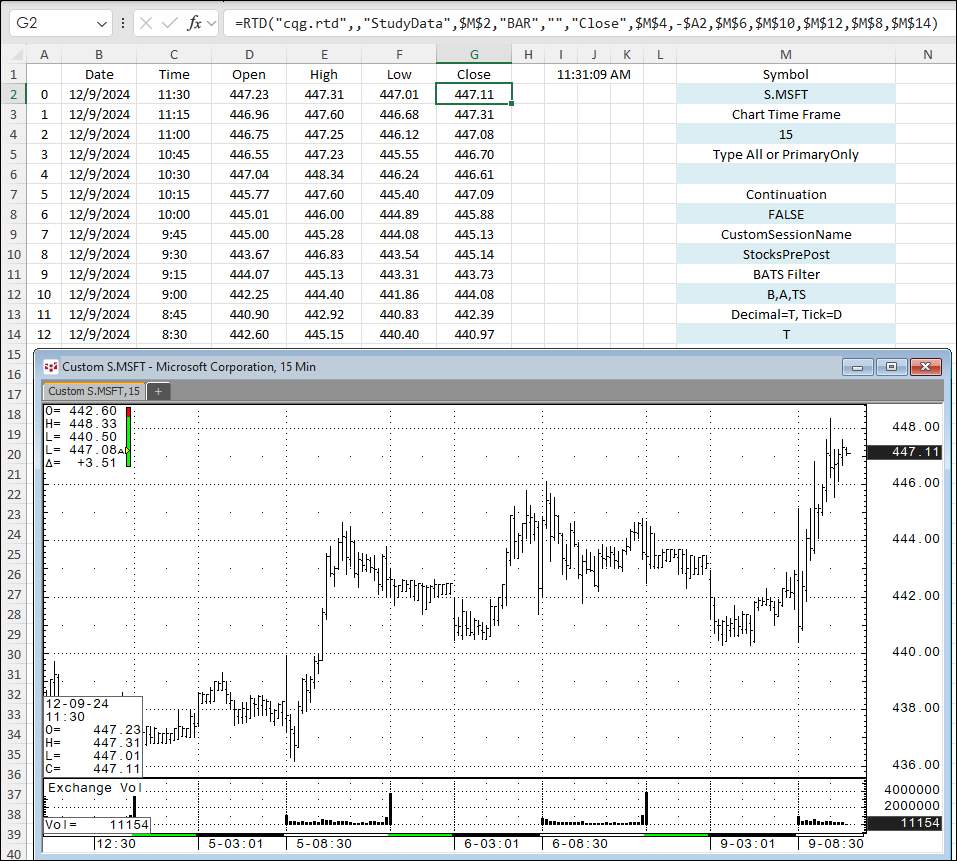
The post Excel: View Pre and Post session for Stocks Using RTD Formulas presented the RTD formulas for pulling in historical data into Excel.
This post details the design of the downloadable Excel dashboard at the end of the post that presents a quote style dashboard for 30 stocks. The dashboard shifts its focus depending on the time through four periods:
- Pre-Market
- Current Market
- Post-Market
- Closed
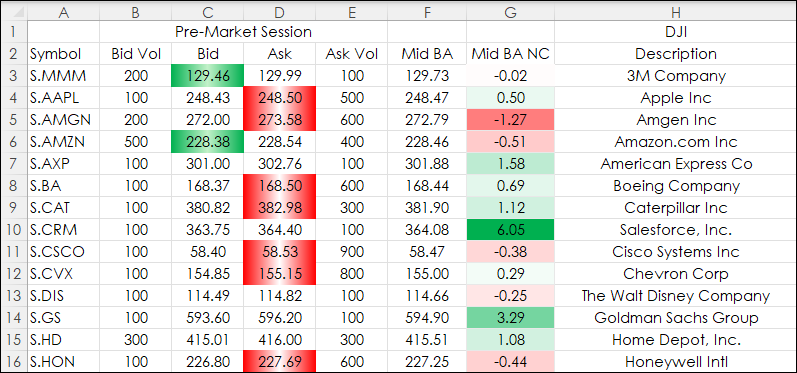
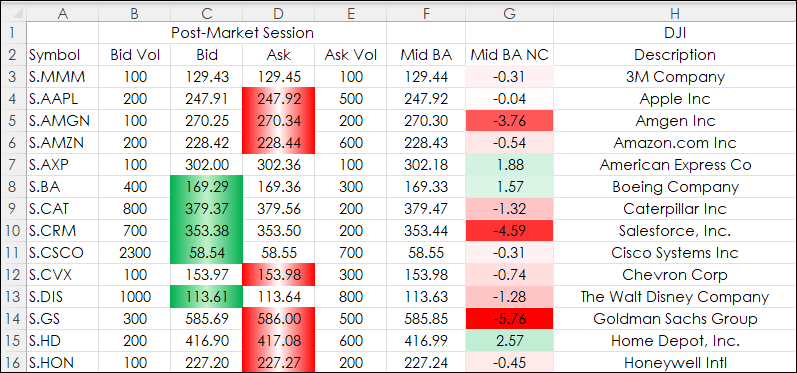
The Pre-Market session encompasses displaying Bid Volume, Bids, Asks, Ask Volume from 3:00 to 8:30 (Central time). The mid-point between the bid and the ask is displayed and the difference between the mid-point and the recent settlement. The bids are highlighted green if the bid volume is greater than the ask volume. The asks are highlighted red if the ask volume is greater than the bid volume.
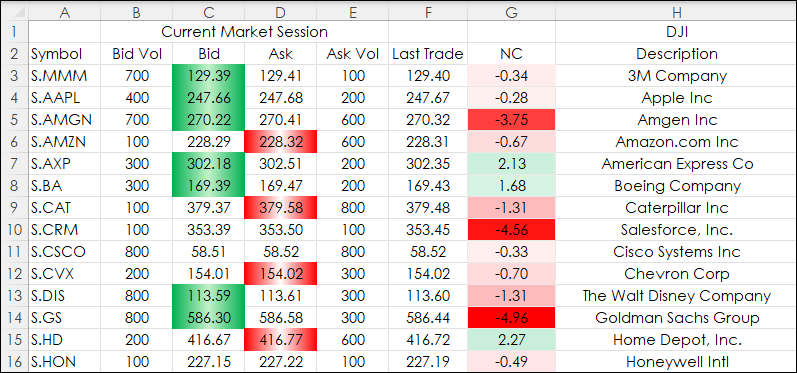
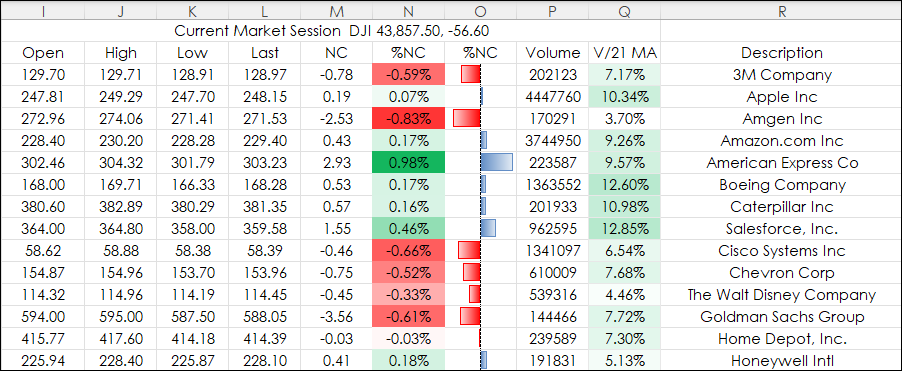
At 8:30 the current market session starts and column F switches to Last Trade and Net Change.
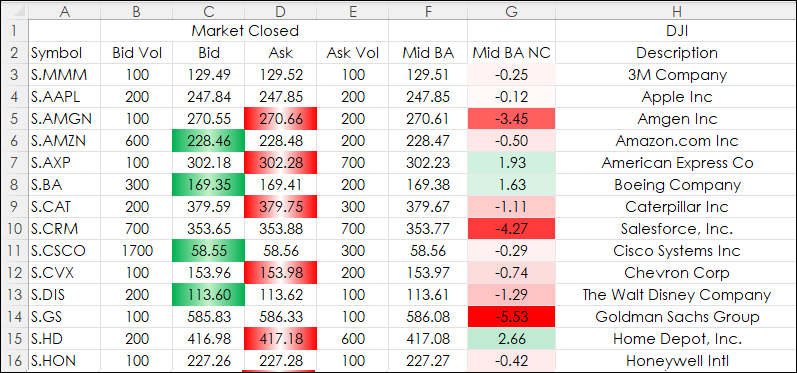
At 15:00 the current market session closes and column F switches to the mid-point between the bid and the ask and the difference between the mid-point and the recent settlement.
At 19:00 the market is closed.
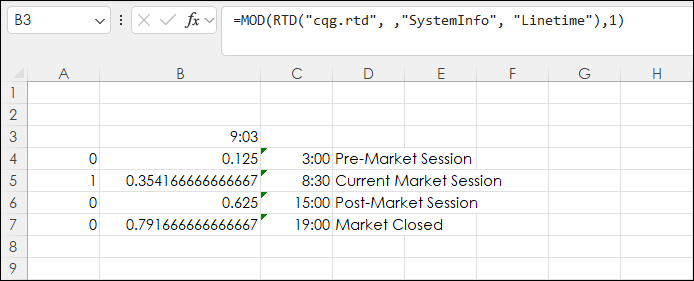
The choice of the sessions to monitor is managed on the Time tab. Cell B3 has the current line time (Central) with Excels "Mod" function applied. The RTD formula returns the Date and Time and the Mod function removes the date.
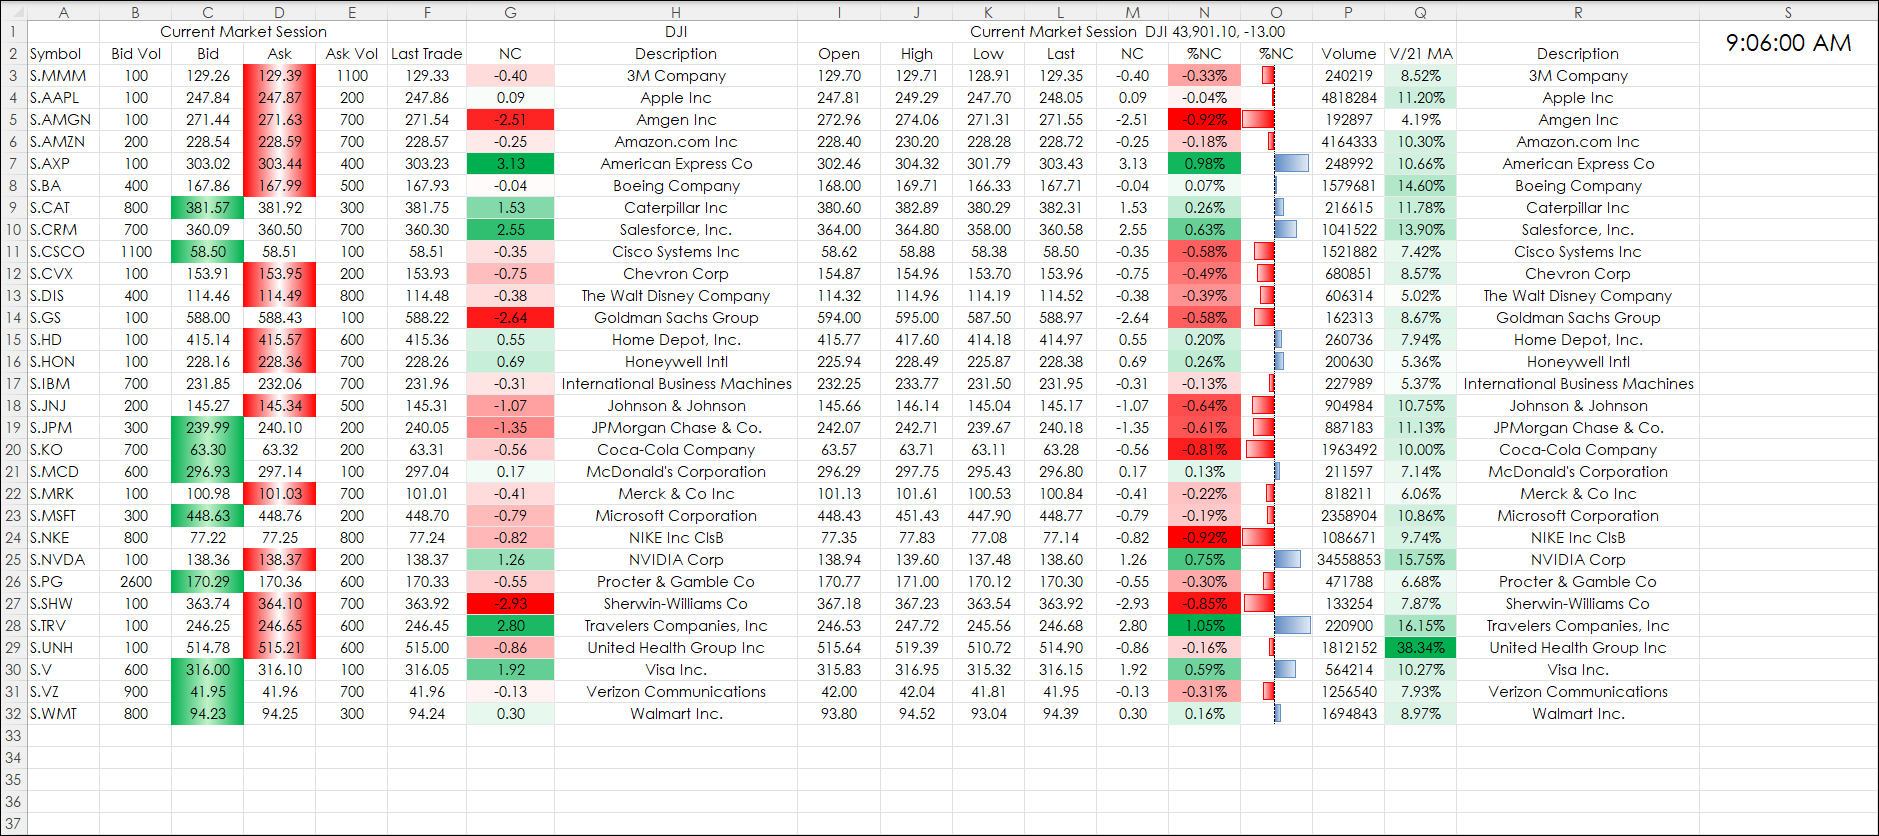
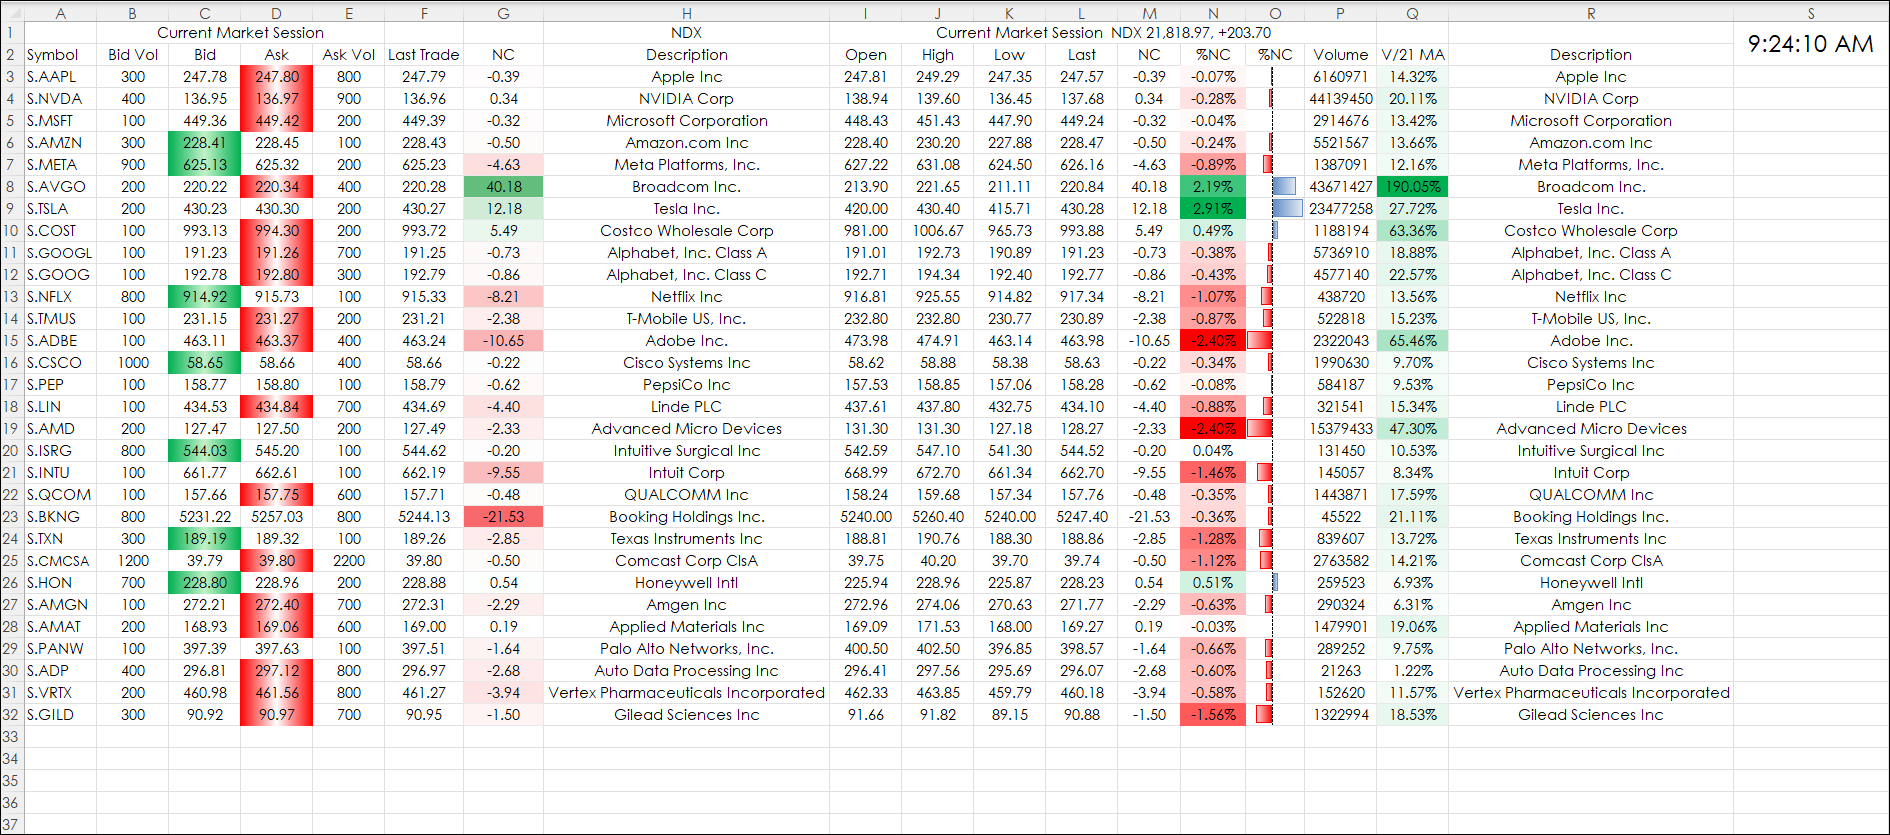
The center portion of the dashboard displays the current market session activity and includes the standard data. Plus, today's volume and the ratio of today's volume compared to the previous 21-day moving average of the volume (which is a fixed value).
Two downloadable Excel Dashboards are provided. One is the 30 stocks in the Dow Jones Industrial Average.
The second uses the top 30 holdings in the NASDAQ 100 index.
The dashboard is locked but no password is required. The symbols column is not locked.
You may find the color conditioning makes the dashboard too busy. Simply, unlock the dashboard, select the bid and ask cells, then click the Home tab on the ribbon, then Conditional Formatting and then Clear Rules.
The dashboard could be useful for monitoring stocks' reactions to economic numbers during the Pre-Market sessions and reactions to earnings announcements during the Post-Market sessions.
Requirements: CQG Integrated Client or QTrader, and Excel 2016 (locally installed, not in the Cloud) or more recent.
