Markets move through phases: An uptrend (higher highs preceded by higher lows), a downtrend (lower lows preceded by lower highs) and sideways or consolidation price action.
Technical based traders look to a host of indicators to identify which phase a market is in to base trading decisions. One such indicator is the TTM Squeeze Indicator, which is a volatility and momentum indicator developed by John Carter of Trade the Markets (now Simpler Trading). The TTM Squeeze Indicator is the topic of this post. At the end of the post is a downloadable CQG PAC that installs a page with a chart and the TTM Squeeze Indicator applied to the chart.
The squeeze in the name is referencing the use of Bollinger Bands' relationship to Keltner Channels to identify when a market is in a consolidation phase which can be a precursor to an uptrend or a downtrend.
Bollinger Bands first computes the mean of the prices and then computes the deviations of each price from the mean. The result is the standard deviation. The study is a plot of two standard deviations above and below the mean of the prices, The Keltner channel lines are drawn by adding to and subtracting from the mean of the prices the product of a constant (percent) multiplied by the average true range of each bar. Consequently, the two studies are similar as they are based on using the same mean, but the Bollinger Bands are much more volatile, while Keltner Channels are smoother.
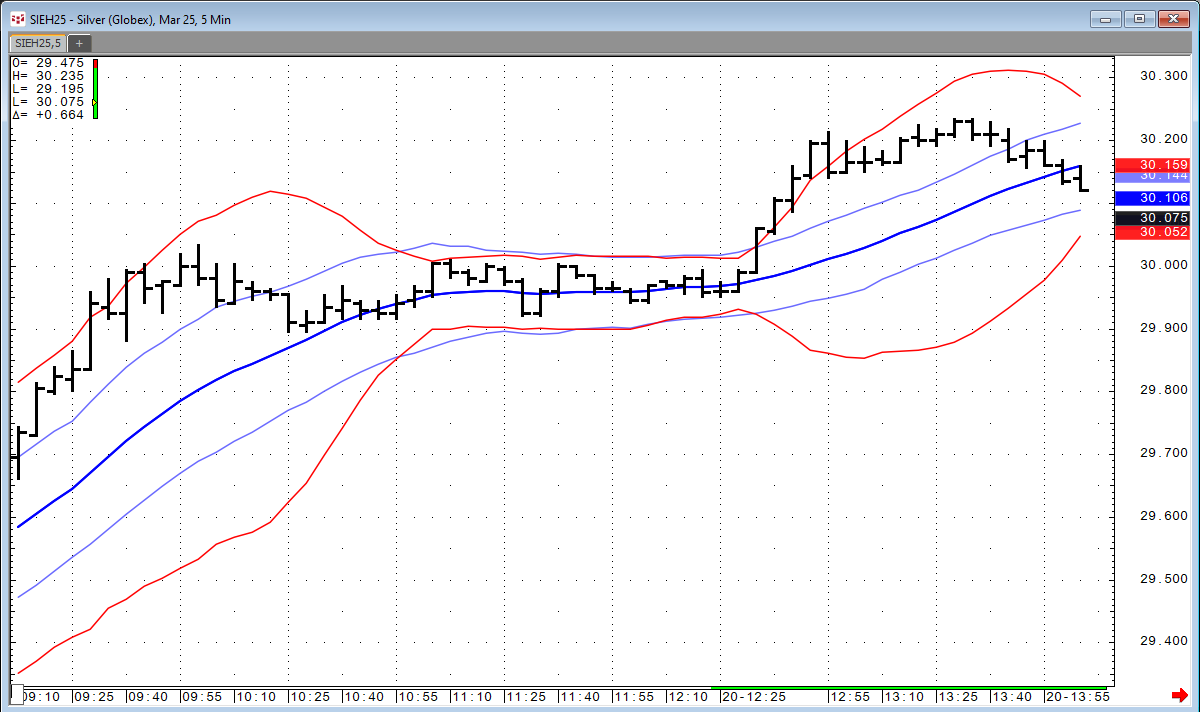
This image below displays the Bollinger Bands (red lines) and the Kelter Chanels (light blue lines) plotted about the mean (dark blue line), which are the same for the two indicators. Both use a lookback of 20 bars. The Kelter Channel is using 150% for the constant.
Above, when the market is trending higher, the Bollinger Bands are expanding and are outside the Keltner Channels. When the market is trading sideways the Bollinger Bands contract and move to be inside the Keltner Channel. This is the signal that the squeeze is on. The market then starts another uptrend, the Bollinger Bands move outside the Keltner Channel and the squeeze is off.
At the start of this post the TTM Squeeze Indicator was described as a volatility and momentum indicator. The volatility aspect is the condition being met that the Bollinger Bands are inside the Keltner Channels. This condition is displayed as a dot on the momentum indicator.
The momentum indicator is the 15-period difference between the closing prices smoothed by a 5 period moving linear regression.
The oscillator is applied to the chart below.
The downloadable PAC includes conditions for marking the histograms of the oscillator.
Both the upper and lower Bollinger Bands are equal distances from the mean. And the upper and lower Keltner Channels are equal distances from the mean. Therefore, if the Bollinger Band high is less than the Kelter Channel high then the Bollinger Band low will be greater than the Kelter Channel low.
During the squeeze if the oscillator is negative then a red dot is plotted below the histogram. If the oscillator is positive then a green dot is plotted above the histogram during the squeeze.
Look for a period where the Bollinger Bands are inside the Keltner Channels (the squeeze). This indicates low volatility and can be a precursor to an upcoming breakout.
Next, the squeeze is "released" when the Bollinger Bands close outside the Keltner Channels and a price trend could occur.
Look for the histogram to turn dark green (bullish) or red (bearish). Green bars indicate a potential bullish trend, while red bars suggest a potential bearish trend.
All of the parameters of the studies can be modified.
The TTM Squeeze indicator is an interesting combination of measuring volatility and momentum and with further testing may be a valuable component for making trading decisions.
Requirements: CQG Integrated Client or QTrader.


