
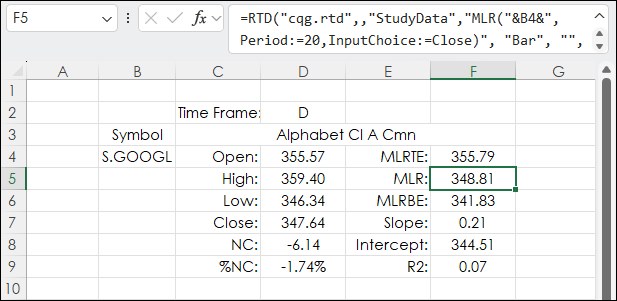
CQG offers the Moving Linear Regression Line study. When plotted on a chart the line (blue line below) is the endpoint of a best fit line using the least squares technique. This technique finds… more
Thom Hartle

This midweek look shows the Nikkei 225 (Osaka), Dec 26 contract, with a loss of -3.83%. The best performer in the US market is the E-mini Dow, Dec 26 contract showing a loss of -0.53%. The… more
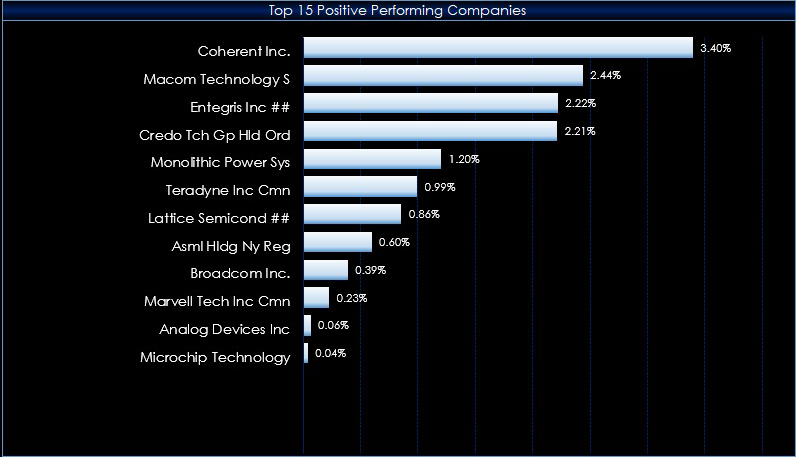
This post details a Microsoft Excel dashboard that tracks the day's performance of the holdings of the Invesco PHLX Semiconductor ETF (Symbol: SOXQ).
From the Invesco website regarding the… more
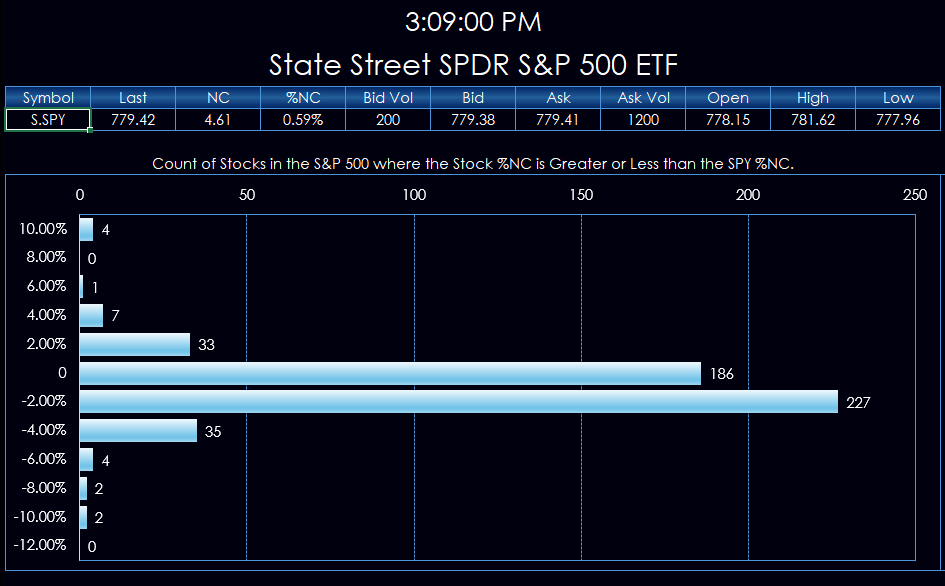
This post details a Macro-Enabled Excel Dashboard that tracks the holding of the S&P 500 Index and compares the percentage net change of each stock to the percentage net change of the cash S… more
This midweek look shows the Nikkei 225 (Osaka), Dec 26 contract, with a gain of +1.68%. The best performer in the US market is the E-mini S&P 500, Dec 26 contract showing a gain of +0.… more
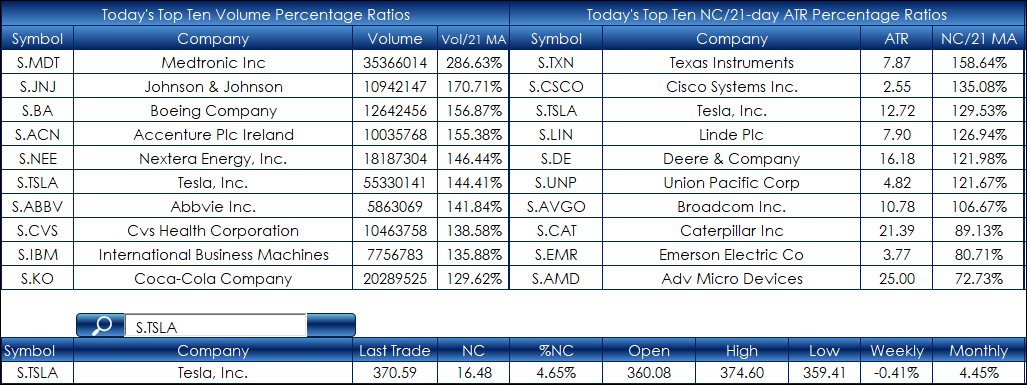
This post is an update to: Excel 365: NASDAQ 100 Screening Dashboard.
Instead of the NASDAQ 100 Index, the iShares S&P 100 ETF (Symbol: S.OEF) is used. The ETF seeks to track an index… more
This midweek look shows the Nikkei 225 (Osaka), Dec 26 contract, with a gain of +1.51%. The best performer in the US market is the E-mini NASDAQ-100, Dec 26 contract showing a loss of -0.11… more
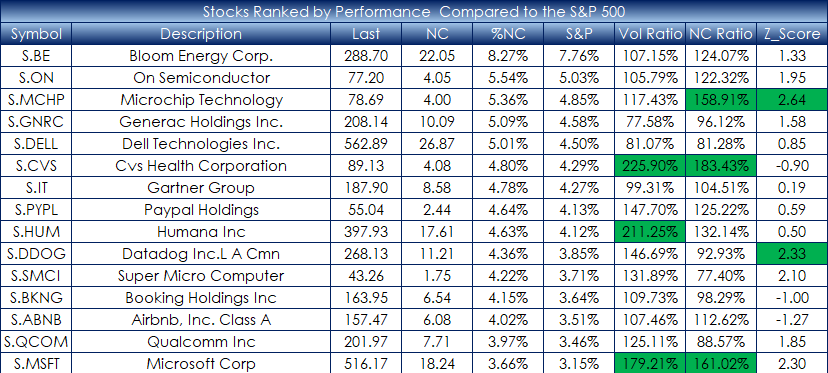
This post details using Excel's MAP function to rank the companies in the S&P 500 index performance relative to the S&P 500 index's performance. This is defined by today's percentage net… more
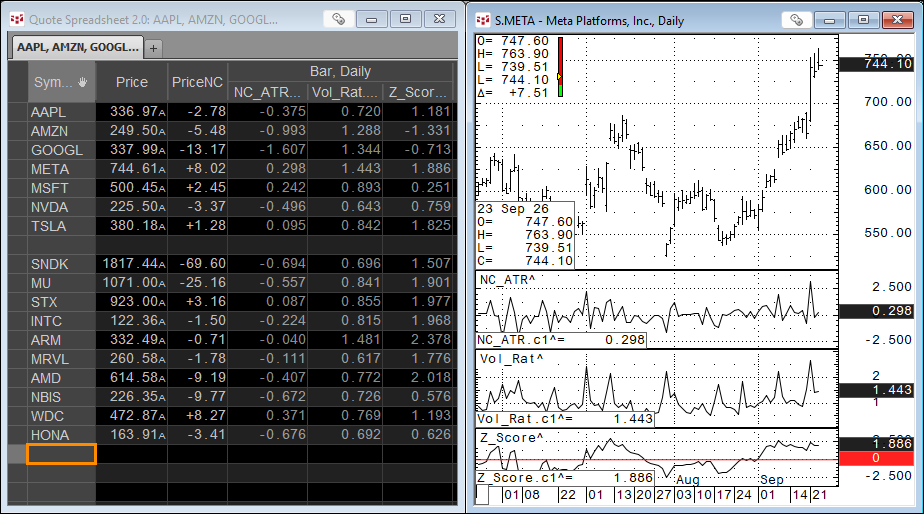
Technical studies are used to analyze markets and are often the basis for trading decisions. The studies all take market data and apply mathematical steps that result in a single value.
An… more
This midweek look shows the Nikkei 225 (Osaka), Dec 26 contract, with a gain of +1.29%. The best performer in the US market is the E-mini NASDAQ-100, Dec 26 contract showing a gain of +2.81… more