
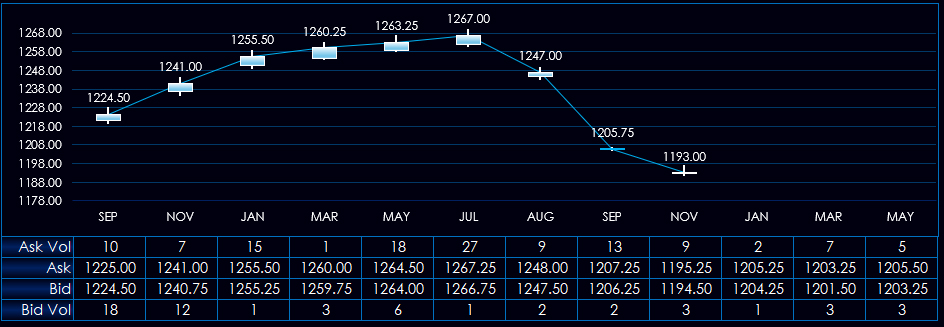
This post details a macro-enabled Excel Dashboard for monitoring Soybeans, Soybean Meal, and Soybean Oil contracts. The macro is a feature for managing the price axis on the charts. Excel may use… more
Workspaces
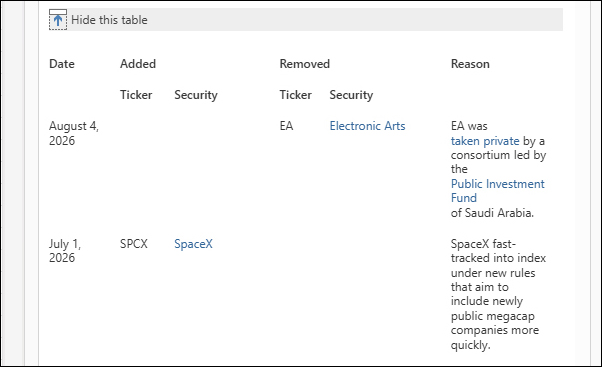
If Microsoft Excel is an app that you utilize for building market screening dashboards then you might periodically require updating the symbols used in the dashboards. For example, using an Excel… more
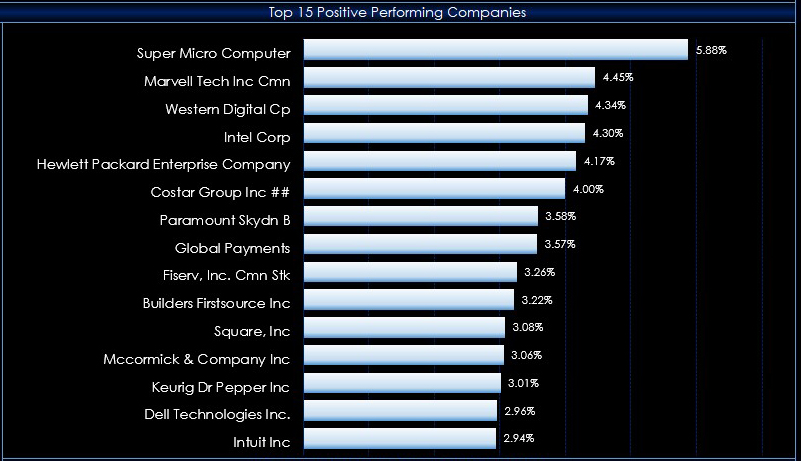
This year, 2026, has seen a rotation towards large cap value stock. This post details a downloadable Microsoft Excel dashboard that tracks the current sessions performance of the holdings of the… more
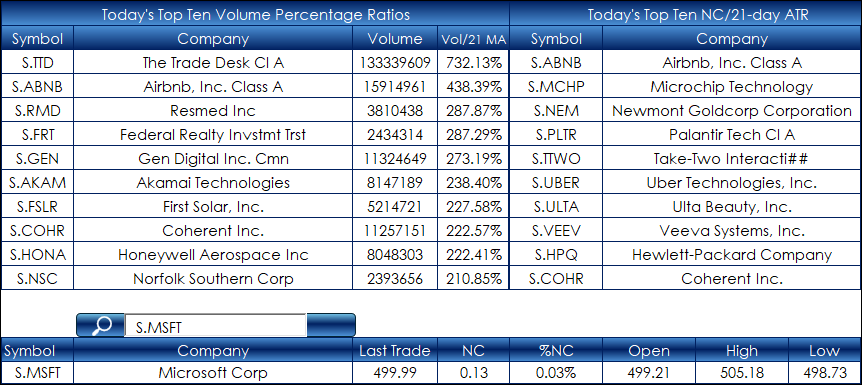
This post is an update to: Excel 365: S&P 500 Screening Dashboard.
The original post offered an Excel dashboard that screened the holdings of the S&P 500 for market performance… more
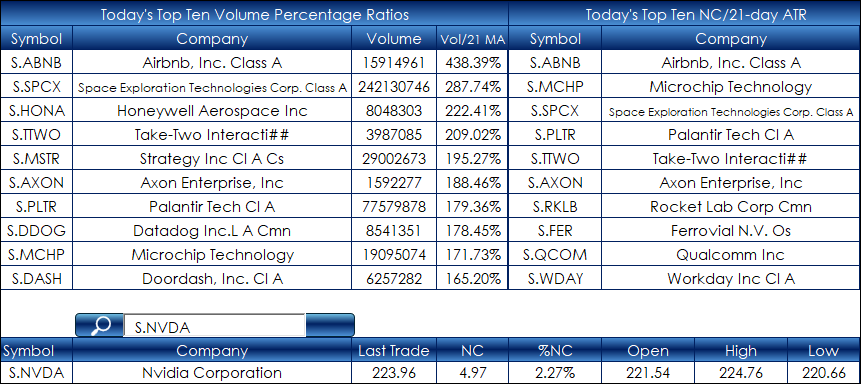
This post is an update to: Excel 365: NASDAQ 100 Screening Dashboard.
The original post offered an Excel dashboard that screened the holdings of the NASDAQ 100 for market performance… more
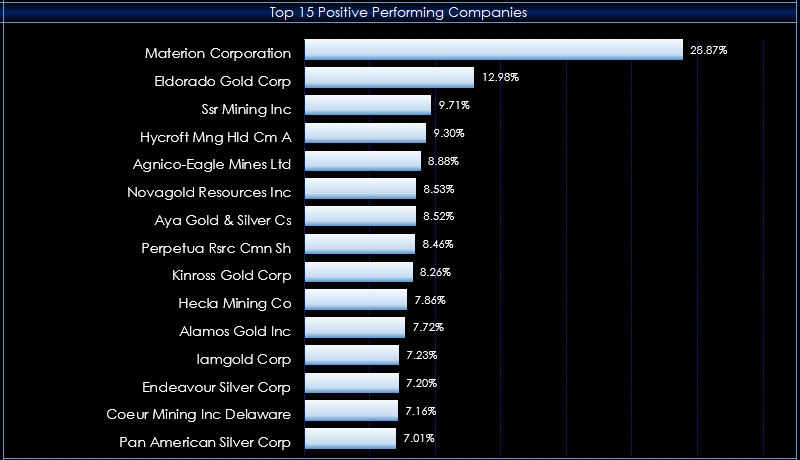
The S&P North American Natural Resources Sector Index is a financial benchmark that measures the performance of U.S. and Canadian publicly traded companies operating within the natural… more
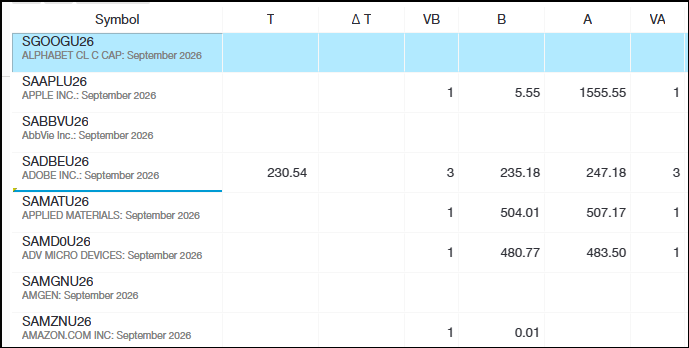
The CME is now offering Single Stock Futures trading. The benefits include:
Around-the-clock trading access. Futures trade nearly 24 hours a day (17:00 CST to 16:00 CST) allowing you to trade… more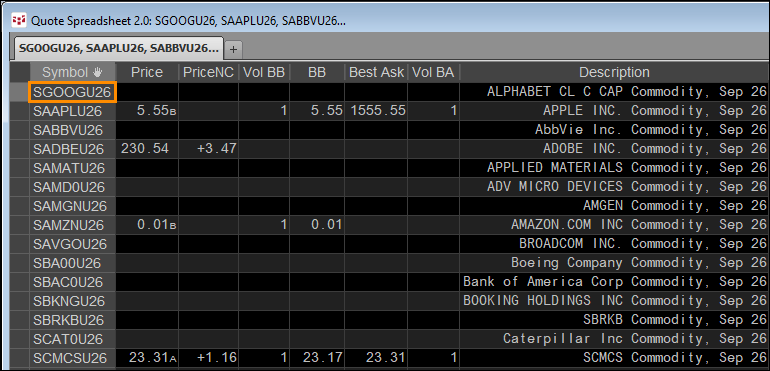
The CME is now offering Single Stock Futures trading. The benefits include:
Around-the-clock trading access. Futures trade nearly 24 hours a day (17:00 CST to 16:00 CST) allowing you to trade… more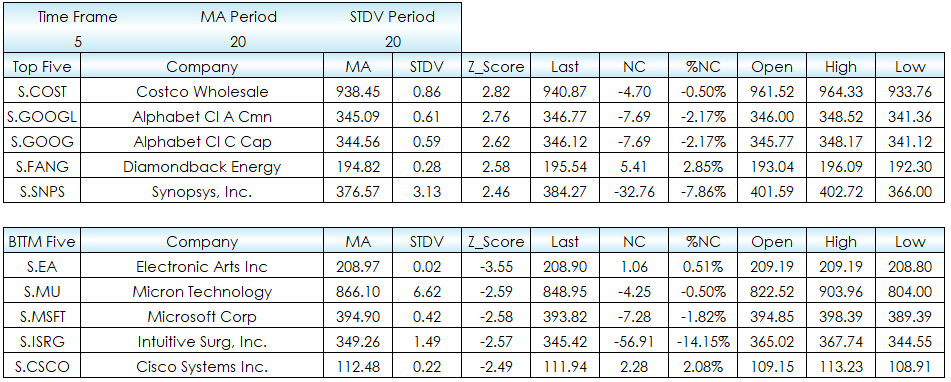
This post details an Excel dashboard for measuring the Z-Score of stocks from the NASDAQ 100. The dashboard sets the parameters as user defined inputs for the time frame, the average lookback… more
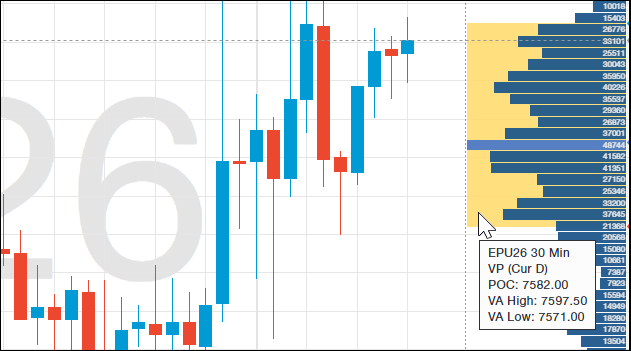
This post details CQG One's Volume Profile Study.
Once applied to a chart, the study calculates the Profile's Value Area and Point of Control (POC).
The value area begins calculating… more