
This post is an update to: Excel 365: NASDAQ 100 Screening Dashboard.
The original post offered an Excel dashboard that screened the holdings of the NASDAQ 100 for market performance characteristics including the weekly, monthly, quarterly, and annual top ten percentage performers and bottom ten percentage performers. In addition, stocks with high volume trading, large net changes, and large Z-Scores are identified. The list of companies in the Index as of 8/04/26.
The Excel dashboard has been updated and includes a "Search Bar" at the bottom of the dashboard.
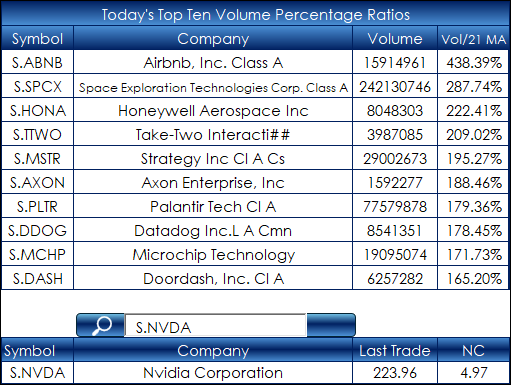
Enter the symbol with the addition of "S." using all capital letters. Only companies listed on the Data Tab are available.
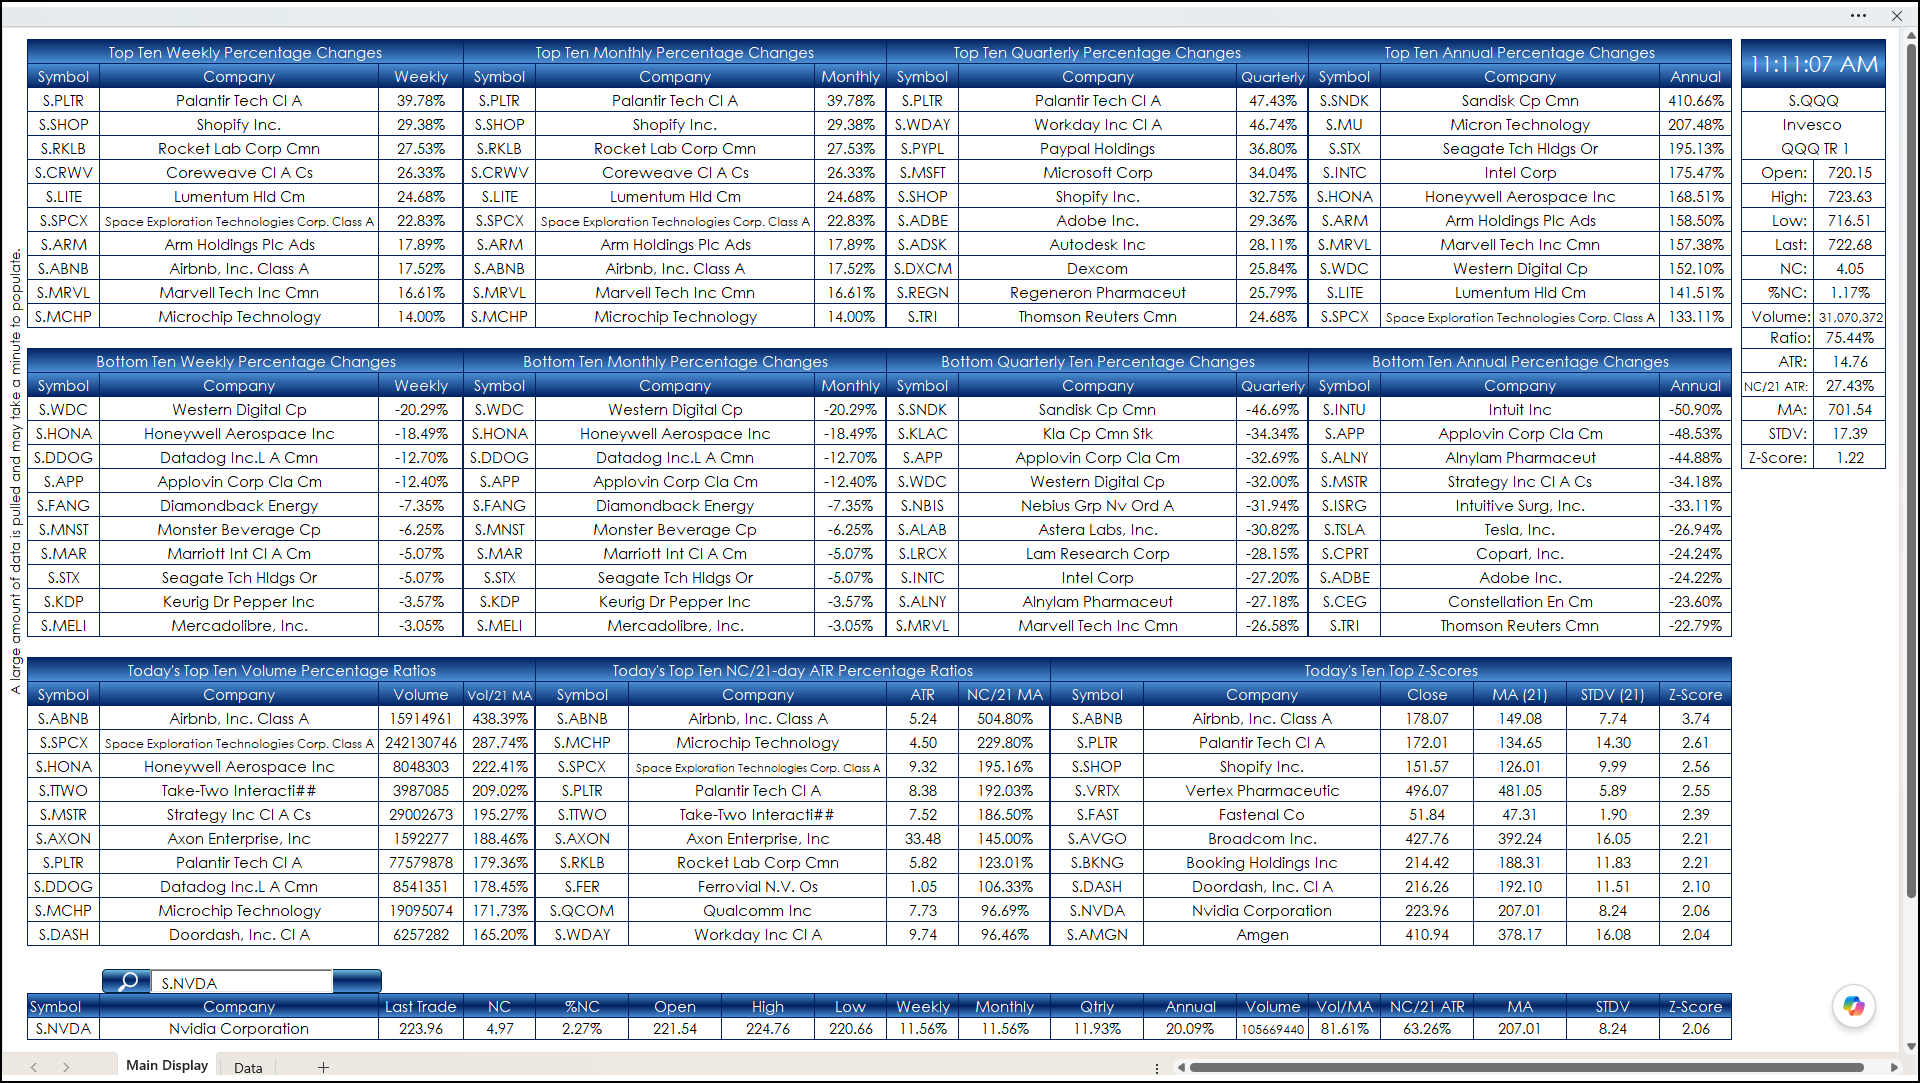
The market performance stats returned are in the bottom row: Symbol, Company, Last Trade, NC, %NC, Open, High, Low, the percentage change using Weekly, Monthly, Quarterly, and Annual views. In addition, the current session's Volume, the Volume Ratio compared to the 21-day Moving average of the Volume, the Net Change ratio to the 21 -day Average True Range, the 21-day Moving Average, the 21-Day Standard Deviation, and the Z-Score ((Close-21 MA)/ 21-Day Standard Deviation).
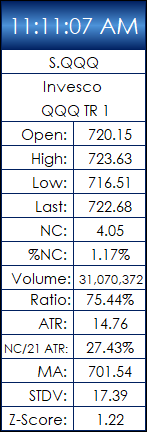
The top right-hand corner lists all of the same statistics for the Invesco QQQ ETF (symbol: S.QQQ).
Below is the image of the new Dashboard:
For all of the details regarding RTD and Excel functions used in the dashboard please review the original post: Excel 365: NASDAQ 100 Screening Dashboard.
The downloadable Excel sample is locked (to avoid accidental editing) but not password protected.
To keep the dashboard’s list of symbols up to date please visit:
https://en.wikipedia.org/wiki/List_of_NASDAQ-100_companies
Search for: “Component changes”.
Then on the Data Tab add new symbols and remove symbols no longer in the index. If needed, copy and paste all of the RTD formulas for any new rows.
Then on the Main Display tab unprotect the sheet:
Review Tab > Unprotect Sheet
Then View > Select Headings > Select Entire Sheet (top left corner above Row 1 and left of Column A.
If you select cell B4 you can see the Excel function is searching cells A2:I103.
=CHOOSECOLS(TAKE(SORTBY(Data!A2:I103,Data!I2:I103,-1),10),1)
If the updated Data tabs with a new symbol now have symbols to row I104 then all of the functions need to be updated.
Then Home > Find and Select > Replace
Replace the current Last Row (103) with the new last row (104).
Then lock the spreadsheet without a password.
Review Tab > Protect Sheet and do not enter a password.
Make sure to lower your Excel Realtime Data (RTD) throttle to 100 milliseconds. Learn how to do that here.
Requires CQG Integrated Client or CQG QTrader, data enablements for the NYSE and Nasdaq stocks, and Excel 2016 or more recent locally installed, not in the Cloud.