This midweek look shows the best performer in the Japanese market is the Nikkei 225 (Osaka), Dec 24 contract with a +3.82% gain. The best performer in the US markets is the E-mini NASDAQ-… more
Equities
This midweek look shows the best performer in the Japanese market is the JPX Prime 150 Index, Dec 24 contract with a +0.04% gain. The best performer in the US markets is the E-mini Dow ($5… more
This midweek look shows the best performer in the Japanese market is the TSE REIT Index, Dec 24 contract with a +1.18% gain. The best performer in the US markets is the E-mini NASDAQ-100,… more
This midweek look shows the best performer in the Japanese market is the TSE REIT Index, Dec 24 contract with a -0.39% loss. The best performer in the US markets is the E-mini Dow ($5), Dec… more
This midweek look shows the best performer in the Japanese market is the Nikkei 225 (Osaka), Dec 24 contract with a +5.01% gain. The best performer in the US markets is the E-mini MidCap… more
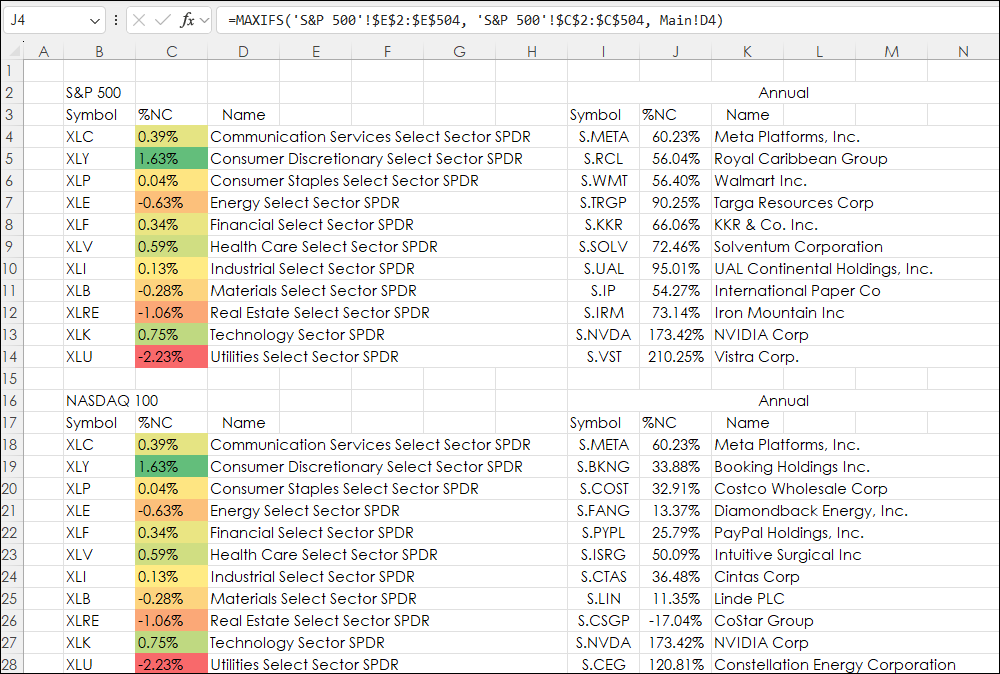
The Excel MAXIF function returns the maximum value from a range of cells and a criteria range. For example. The downloadable sample at the bottom of this post is determining the best performance… more
This midweek look shows the best performer in the Japanese market is the Nikkei 225 (Osaka), Dec 24 contract with a +3.79% gain. The best performer in the US markets is the E-mini MidCap… more
This midweek look shows the best performer in the Japanese market is the TSE REIT Index, Dec 24 contract with a +0.06% gain. The best performer in the US markets is the E-mini S&P 500… more
This midweek look shows the best performer in the Japanese market is the TOPIX, Dec 24 contract with a -0.07% loss. The best performer in the US markets is the E-mini MidCap 400, Dec 24… more
This midweek look shows the best performer in the Japanese market is the Nikkei 225 (Osaka), Dec 24 contract with a +2.83% gain. The best performer in the US markets is the E-mini NASDAQ-… more

