This midweek look shows the Nikkei 225 (Osaka), Sep 25 contract with a +0.35% gain. The best performer in the US market is the E-mini NASDAQ-100, Sep 25 contract showing a loss of -0.05%.… more
Equities
This midweek look shows the Nikkei 225 (Osaka), Sep 25 contract with a -1.14% loss. The best performer in the US market is the E-mini MidCap 400, Sep 25 contract showing a gain of +2.21%.… more
This midweek look shows the Nikkei 225 (Osaka), Sep 25 contract with a +1.49% gain. The best performer in the US market is the E-mini NASDAQ-100, Sep 25 contract showing a gain of +2.82%.… more
This midweek look shows the Nikkei 225 (Osaka), Sep 25 contract with a +2.38% gain. The best performer in the US market is the E-mini MidCap-400, Sep 25 contract showing a gain of +0.72%.… more
This midweek look shows the Nikkei 225 (Osaka), Jun 25 contract with a +1.51% gain. The best performer in the US market is the E-mini NASDAQ-100, Jun 25 contract showing a gain of +0.42%.… more
This midweek look shows the Nikkei 225 (Osaka), Jun 25 contract with a -1.03% loss. The best performer in the US market is the E-mini NASDAQ-100, Jun 25 contract showing a gain of +1.75%.… more
This midweek look shows the Nikkei 225 (Osaka), Jun 25 contract with a -+1.83% gain. The best performer in the US market is the E-mini NASDAQ-100, Jun 25 contract showing a gain of +1.85%.… more
This midweek look shows the Nikkei 225 (Osaka), Jun 25 contract with a -2.30. The best performer in the US market is the E-mini NASDAQ-100, Jun 25 contract showing a loss of -1.67%. The… more
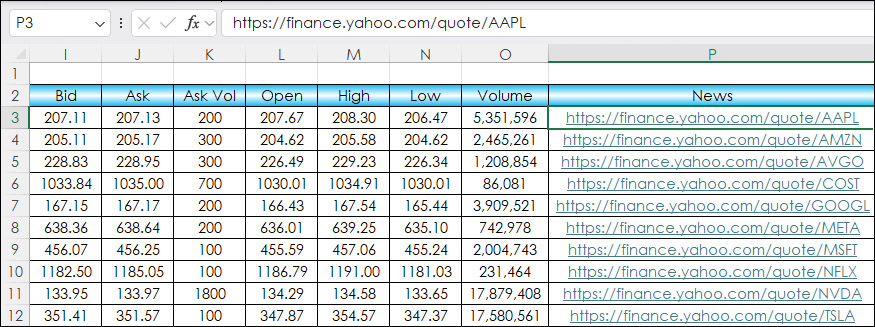
This post details adding HTML News Links to an Excel dashboard for monitoring equities and ETFs.
The news source is Finance.Yahoo.com. An example link for Microsoft is https://finance.yahoo.… more
This midweek look shows the Nikkei 225 (Osaka), Jun 25 contract with a +0.51% gain. The best performer in the US market is the E-mini NASDAQ-100, Jun 25 contract showing a gain of +6.22%.… more

