This post details a Microsoft Excel dashboard that tracks the day's performance of the holdings of the iShares Transportation Average ETF (Symbol: IYT).
The stock market media has been dominated for some time by the performance of the technology sector. However, as of this writing, halfway through the first quarter of 2026 the Dow Jones Industrial Average (Symbol: DIA) closed above 50,000 for the first time.
In the field of technical analysis there is an approach referred to as "The Dow Theory". This technical analysis framework was developed by Charles Dow in the early 1900s. The basic tenet is to identify market trends based on the Dow Jones Industrial Average (DJIA) and Transportation Average (DJTA). It posits that the market requires confirmation between industrial and transportation sectors to validate trends.
A bull market confirmation is both the DJIA and DJTA reach new highs.
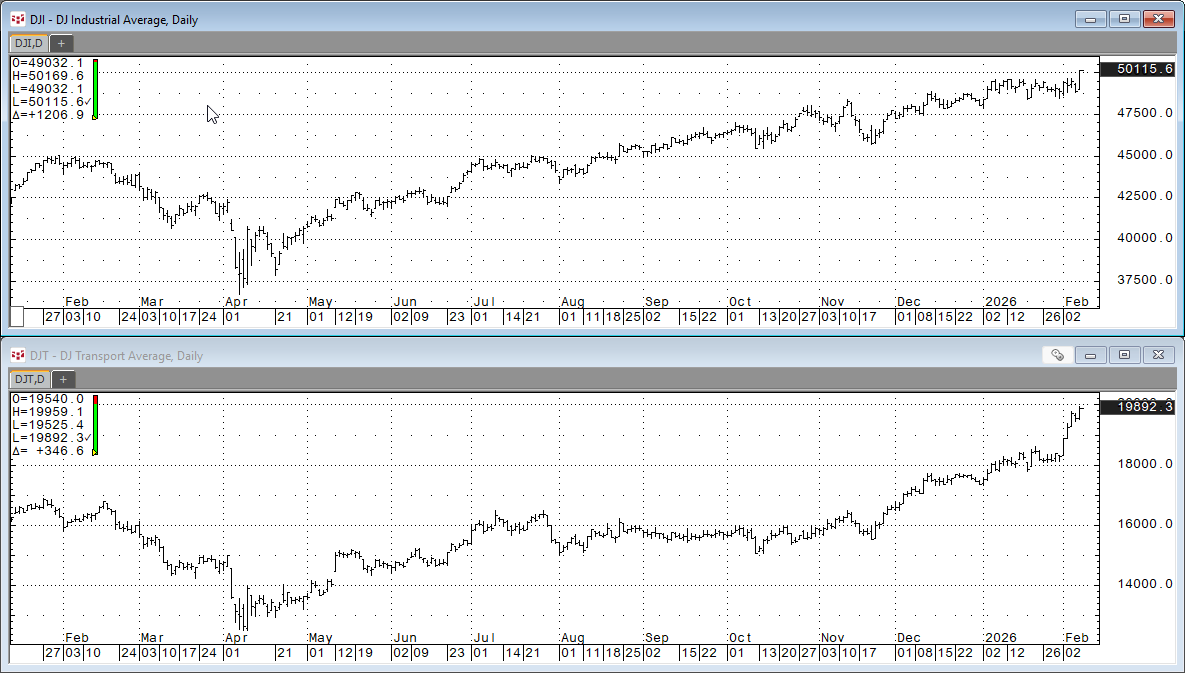
In the image below bot the DJIA and the DJTA have made new highs, which is a bull market confirmation.
A more interesting chart compares the percentage change from the early April 2025 lows for both indexes.
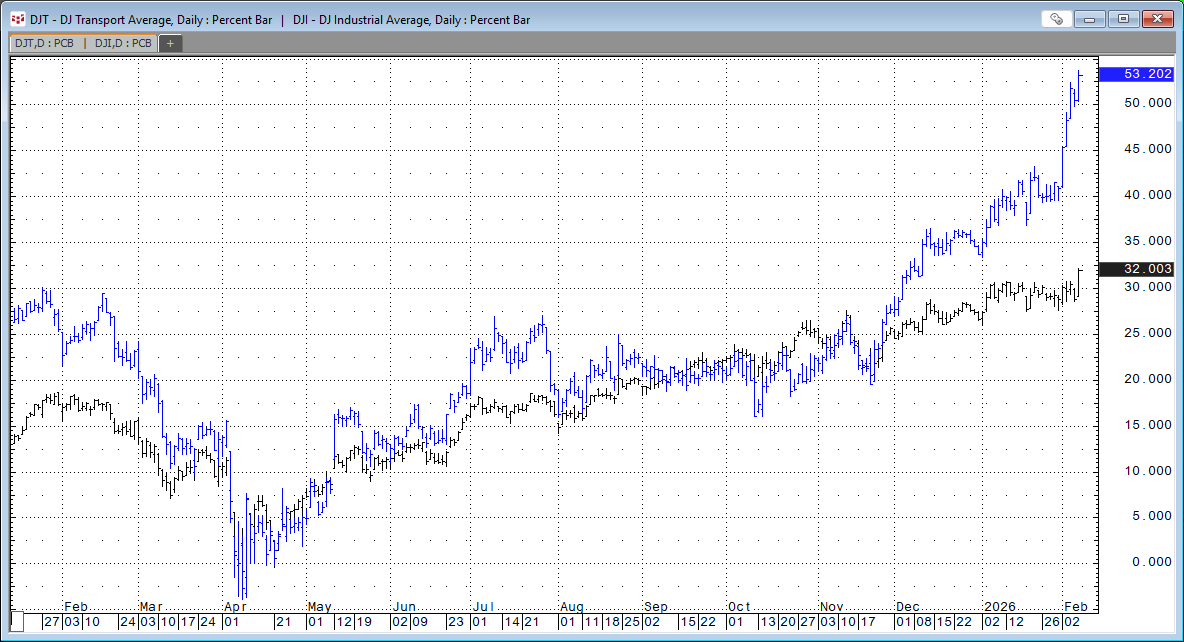
From above, the DJIA is up over 32% and the DJTA is up over 53%.
If you want to participate in the Dow Jones Transportation Average as an investment there is a problem because there is no ETF that uses the DJTA as the core index.
There is an ETF that is focused on the Transportation Industry: iShares Transportation Average ETF (Symbol: IYT).
The ETF offers:
- Exposure to U.S. airline, railroad, and trucking companies
- Targeted access to domestic transportation stocks
- Use to express a sector view
The ETF currently has over $1.16B in assets under management (AUM).
Here is a list of the current top ten holdings:
| Symbol | Name | Weight |
|---|---|---|
| S.UBER | Uber Technologies, Inc. | 16.37% |
| S.UNP | Union Pacific Corp | 15.62% |
| S.UPS | United Parcel Svc | 9.02% |
| S.FDX | FedEx Corp | 5.40% |
| S.ODFL | Old Dominion Freight | 5.18% |
| S.CSX | CSX Corporation | 4.53% |
| S.NSC | Norfolk Southern Corp | 4.40% |
| S.DAL | Delta Airlines, Inc. | 4.21% |
| S.UAL | United Airlines Hld Cm | 4.15% |
| S.LUV | Southwest Airlines Co | 3.78% |
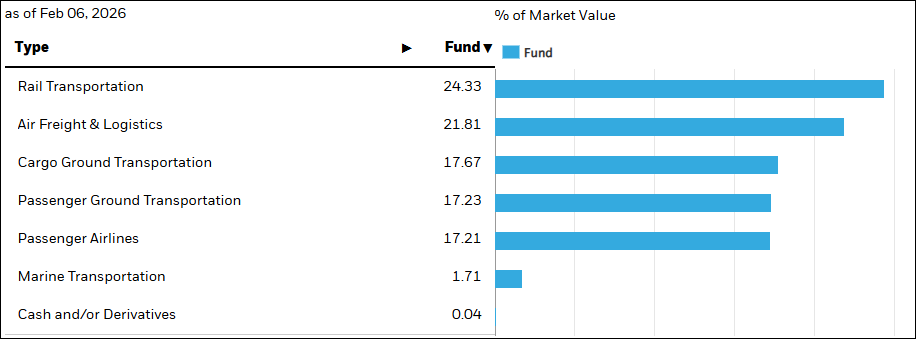
Exposure Breakdown
Below is an image of the downloadable Excel Dashboard. During the trading session, the Excel dashboard dynamically ranks the individual stocks held by IYT. The Excel dashboard displayed below shows the top fifteen positive and bottom fifteen negative performers as histogram bar charts, along with their respective net percent change for today's trading session.
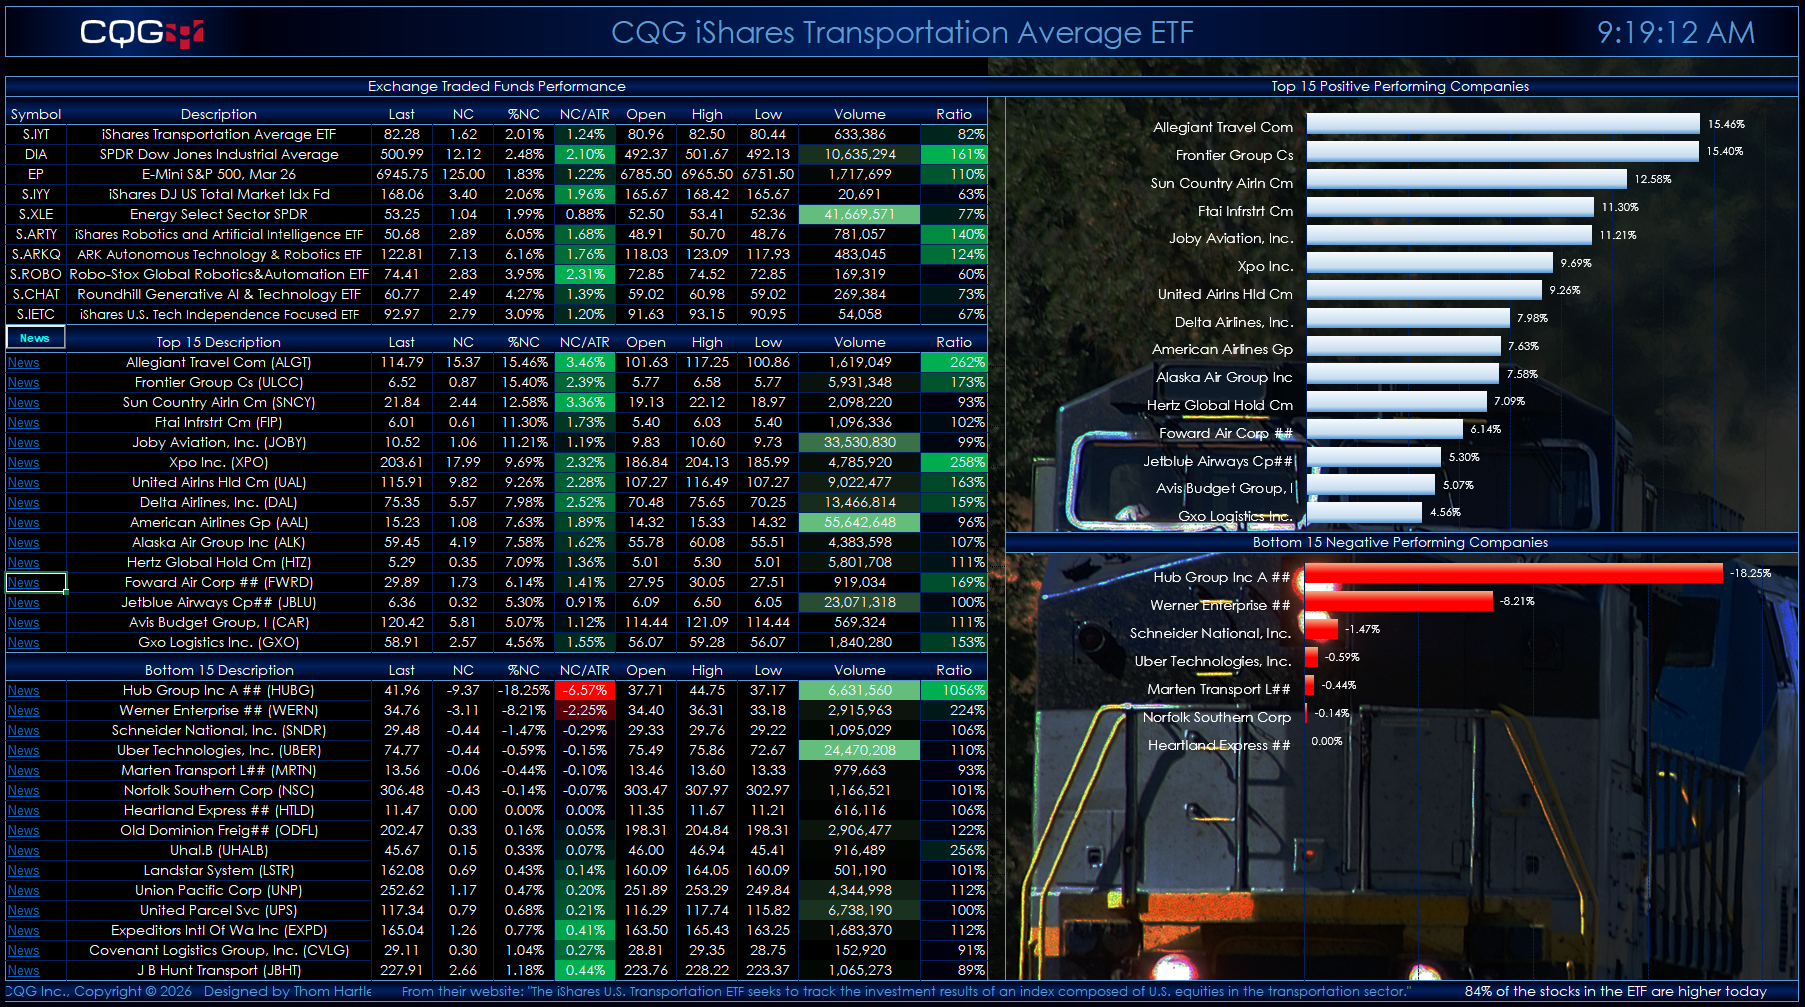
The top section of the quote display allows you to enter your own symbols.
The second section displays the top fifteen performers. The third section displays the bottom fifteen performers.
Quote data includes today's net change as a ratio to the 21-day Average True Range study. Next to today's traded volume is a column that calculates the ratio of today's volume versus the 21-day average of the volume. This ratio column gives you a sense of how active today's trading is relative to recent history. Readings of 100% and higher indicate active trading.
A key feature next to each company name is a link to Yahoo Finance. Clicking the News link will take you to the Yahoo page for that symbol. Note that this could take approximately 30 seconds to open in a browser. Turning off Extensions in your browser will make this happen faster.
If you open another Excel spreadsheet, then this dashboard will no longer be the active spreadsheet. The macro that updates the links and ranks the stocks by performance will stop. To start the macro, simply click the News toolbar button in the first column.
The fund is actively managed. The current holdings are as of 1/09/2026. There is a Symbols tab with instructions detailing where to download the latest posted spreadsheet with the current holdings and steps update the dashboard.
Make sure to lower your Excel Realtime Data (RTD) throttle to 50 milliseconds or lower. Learn how to do that here.
Two dashboards are available: One has a solid black background, and one has an image background.
Requires CQG Integrated Client or CQG QTrader, data enablements for the NYSE and the Nasdaq, and Excel 2016 or more recent.