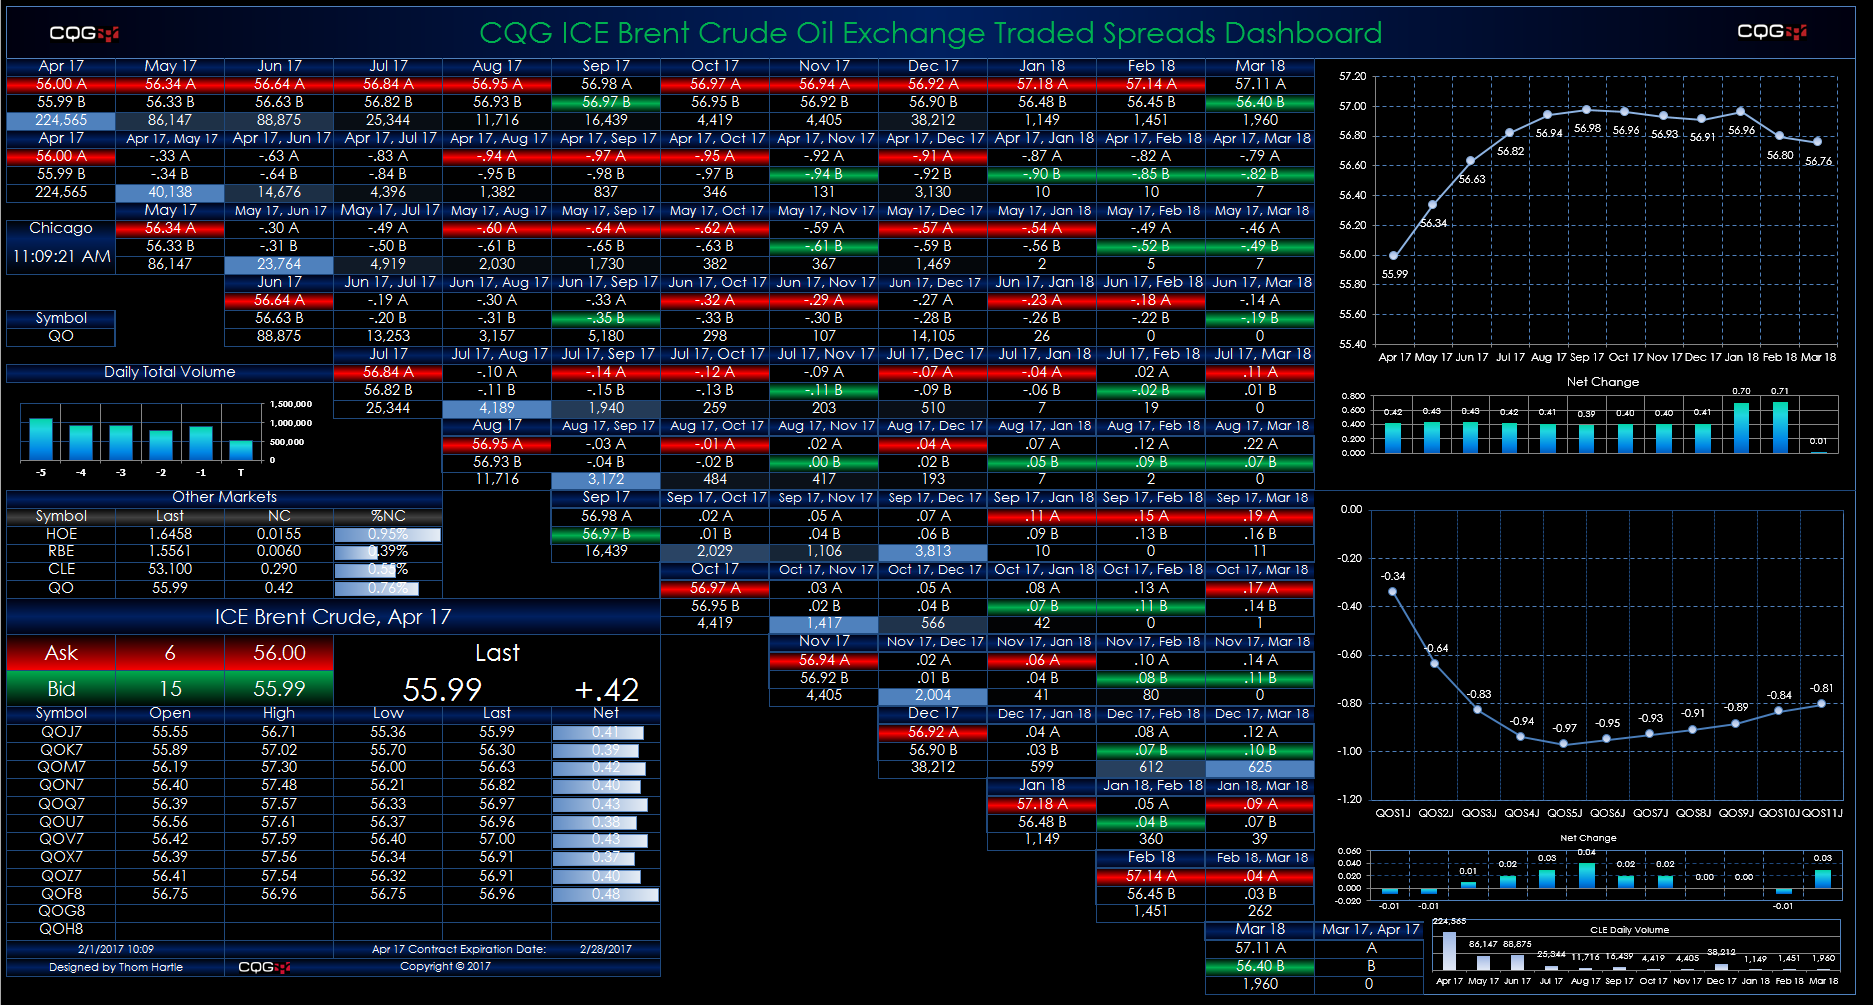
This Microsoft Excel® dashboard displays market data for crude oil spreads traded on the ICE platform using a matrix-style format. The outrights are along the top row and the start of each… more
Spreads
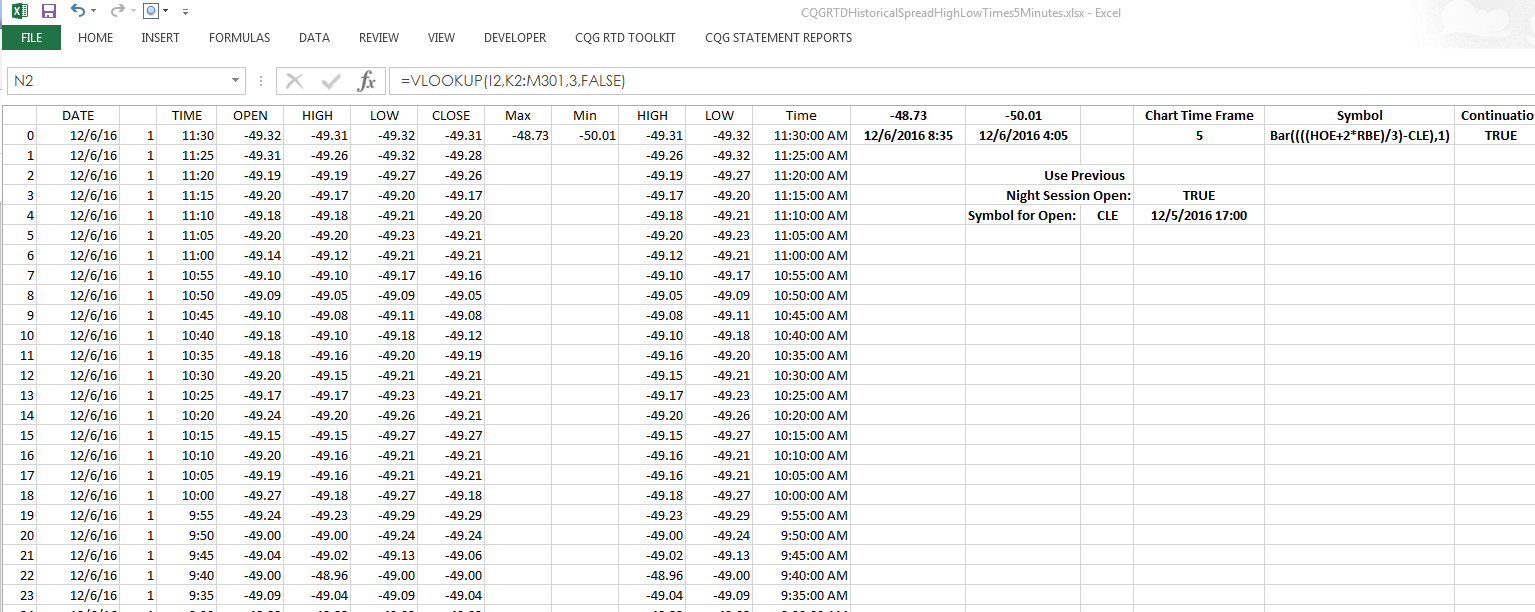
CQG Integrated Client and CQG QTrader customers can pull the time the high and low occurred during today’s session into a Microsoft Excel® spreadsheet using these RTD formulas:… more

This Microsoft Excel® dashboard offers four charts displaying seventy-five open, high, low, and close bars of a spread. The spread symbols are entered into Excel on the symbols tab and the … more
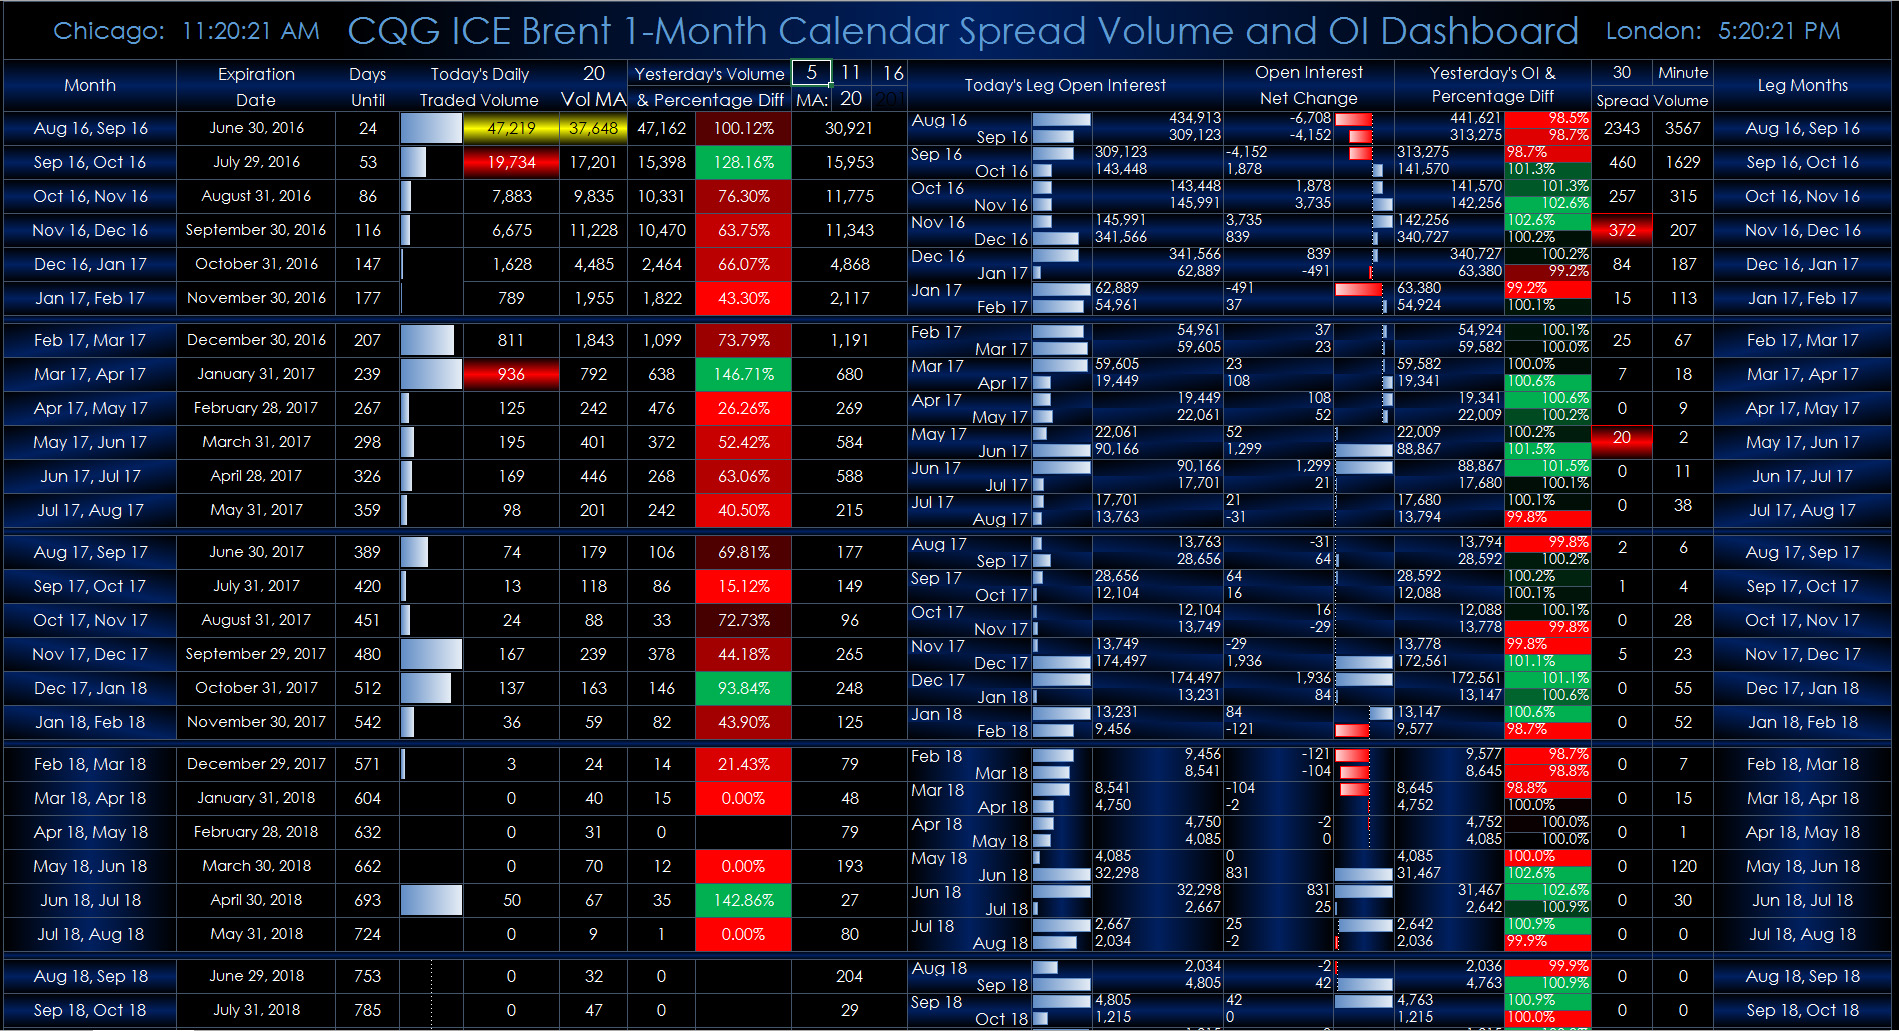
This Microsoft Excel® dashboard displays individual one-month Brent crude oil calendar spreads and their individual legs for tracking the volume and open interest rolls. All of the active… more
Request: I want to plot a historical daily chart of a spread: December Wheat versus December Corn. I want the chart to be a continuation chart and to always use December contracts for the two… more

This Microsoft Excel® dashboard displays individual Euribor 3-month calendar spreads and their individual legs for tracking the rolls. All of the active deliveries for each individual symbol are… more
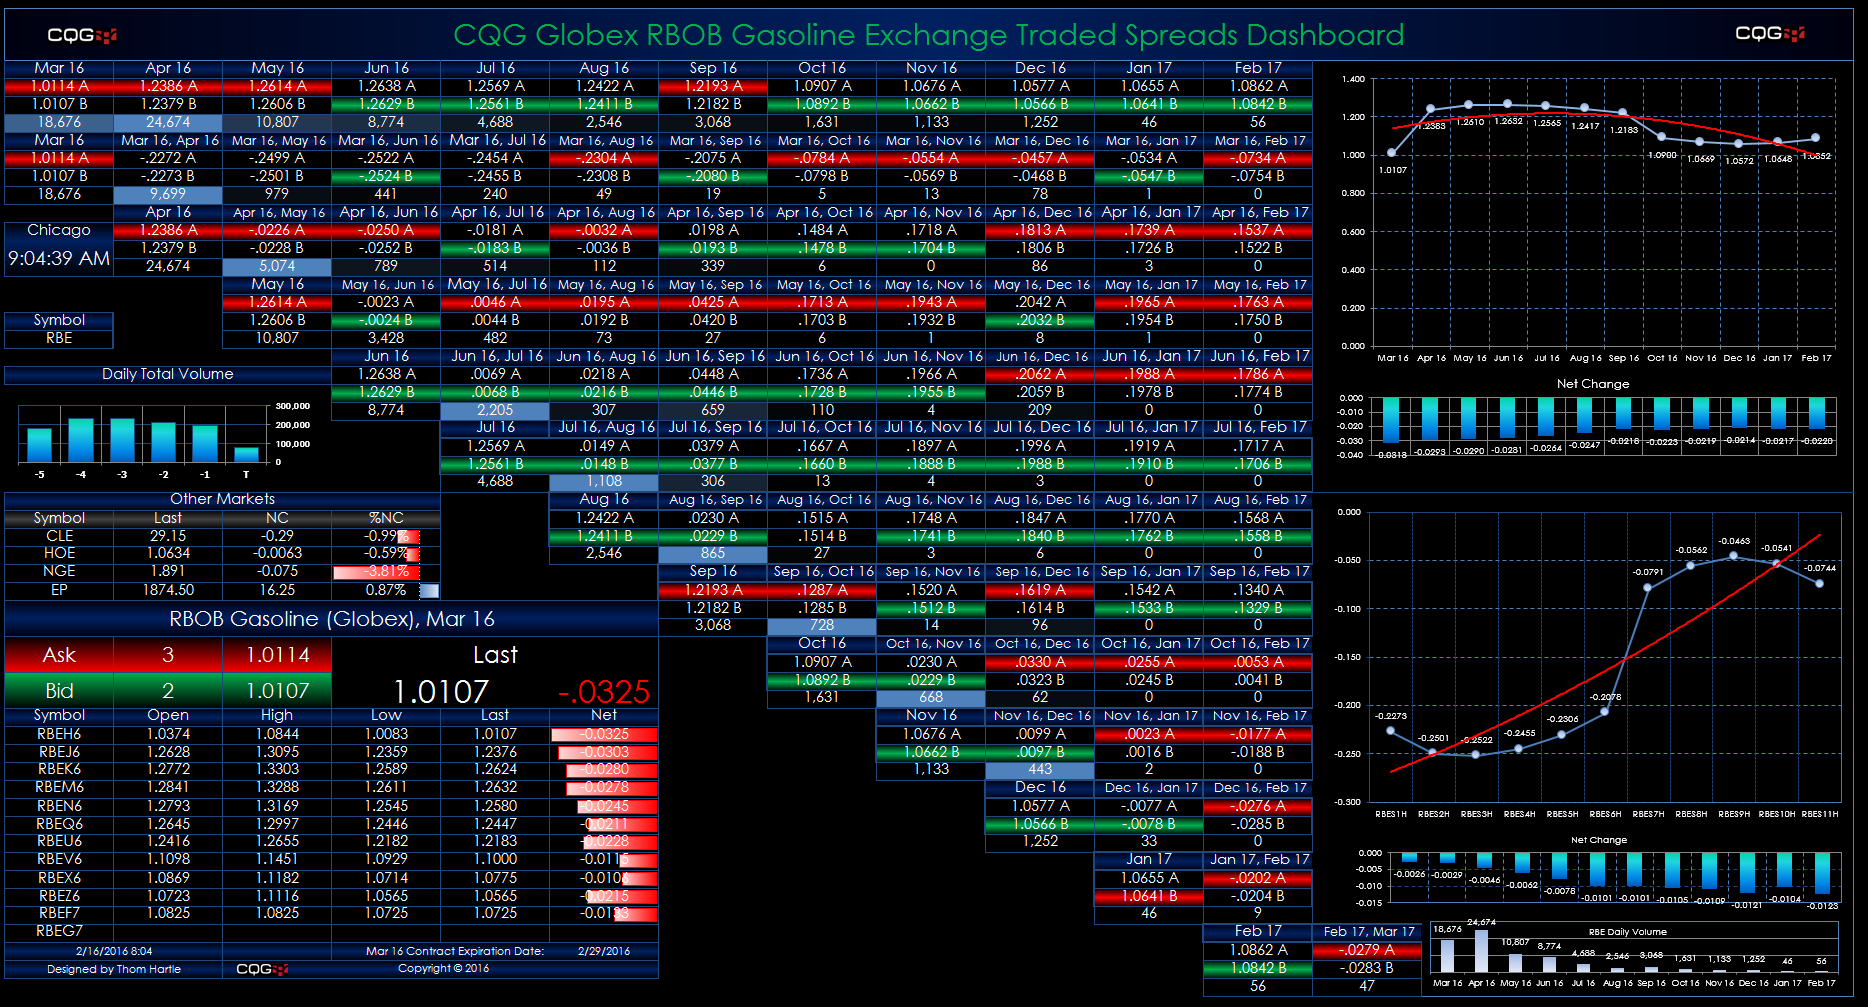
This Microsoft Excel® dashboard displays market data for RBOB Gasoline spreads traded on the CME Globex platform. This monitor uses a matrix style format. The outrights are along the top row and… more
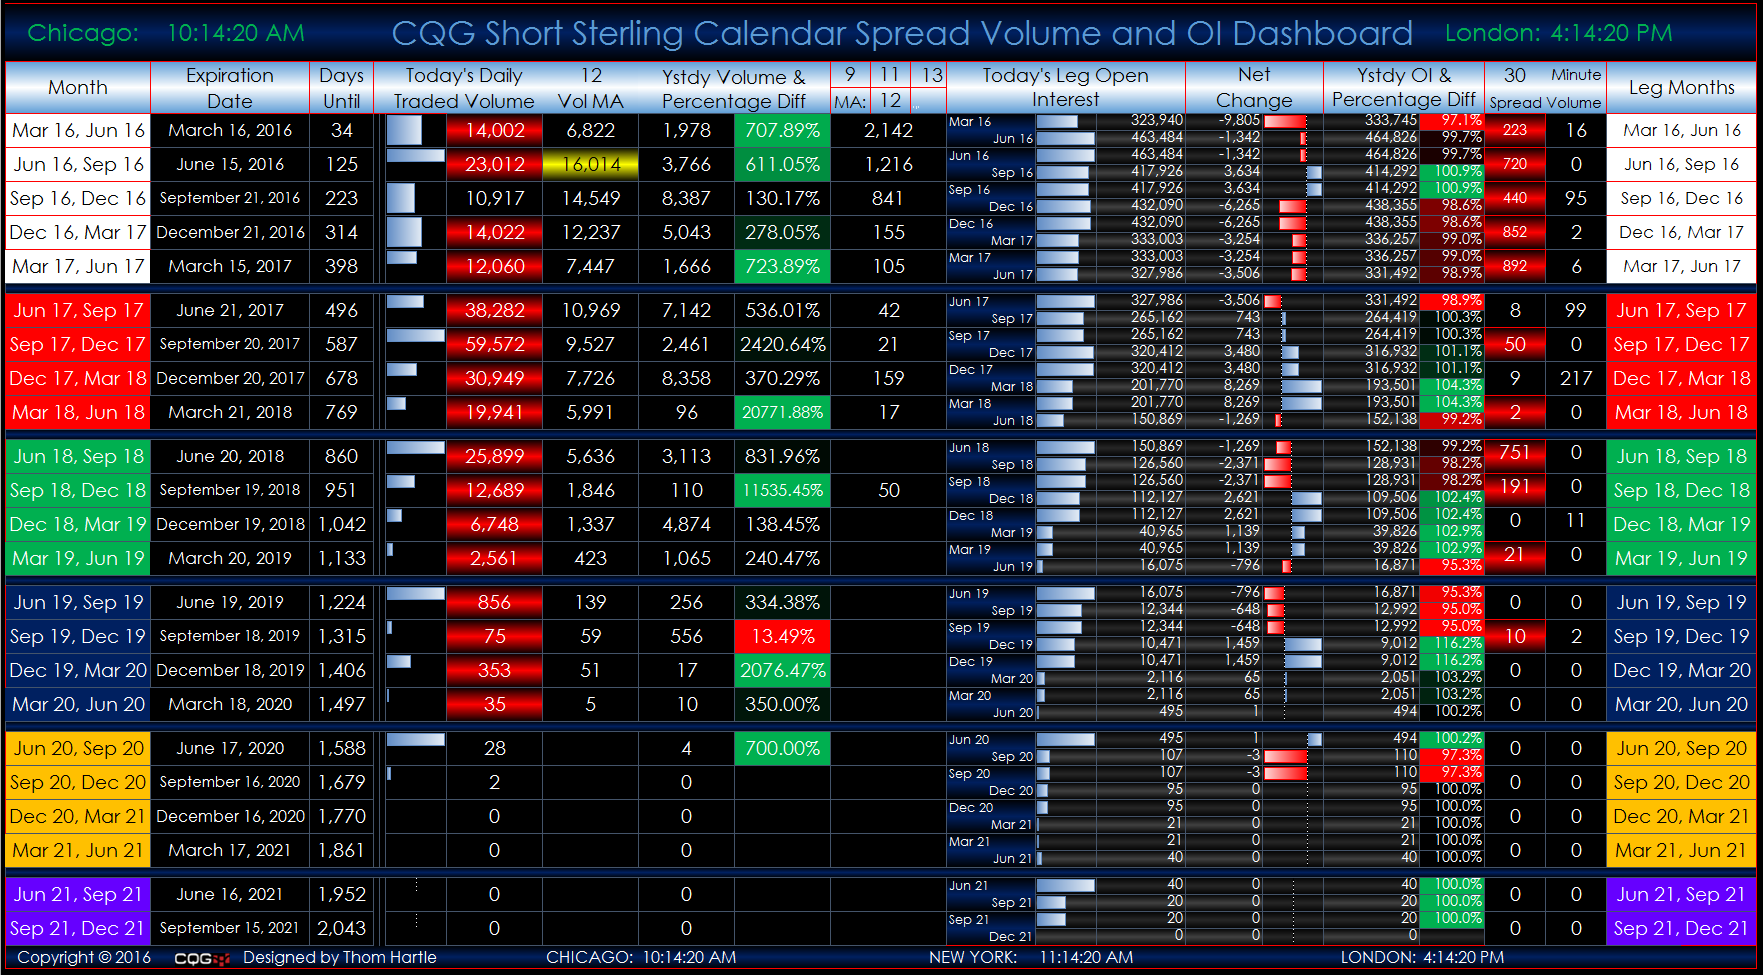
This Microsoft Excel® dashboard displays individual Short Sterling three-month calendar spreads and their individual legs for tracking the rolls. All of the active deliveries for each individual… more
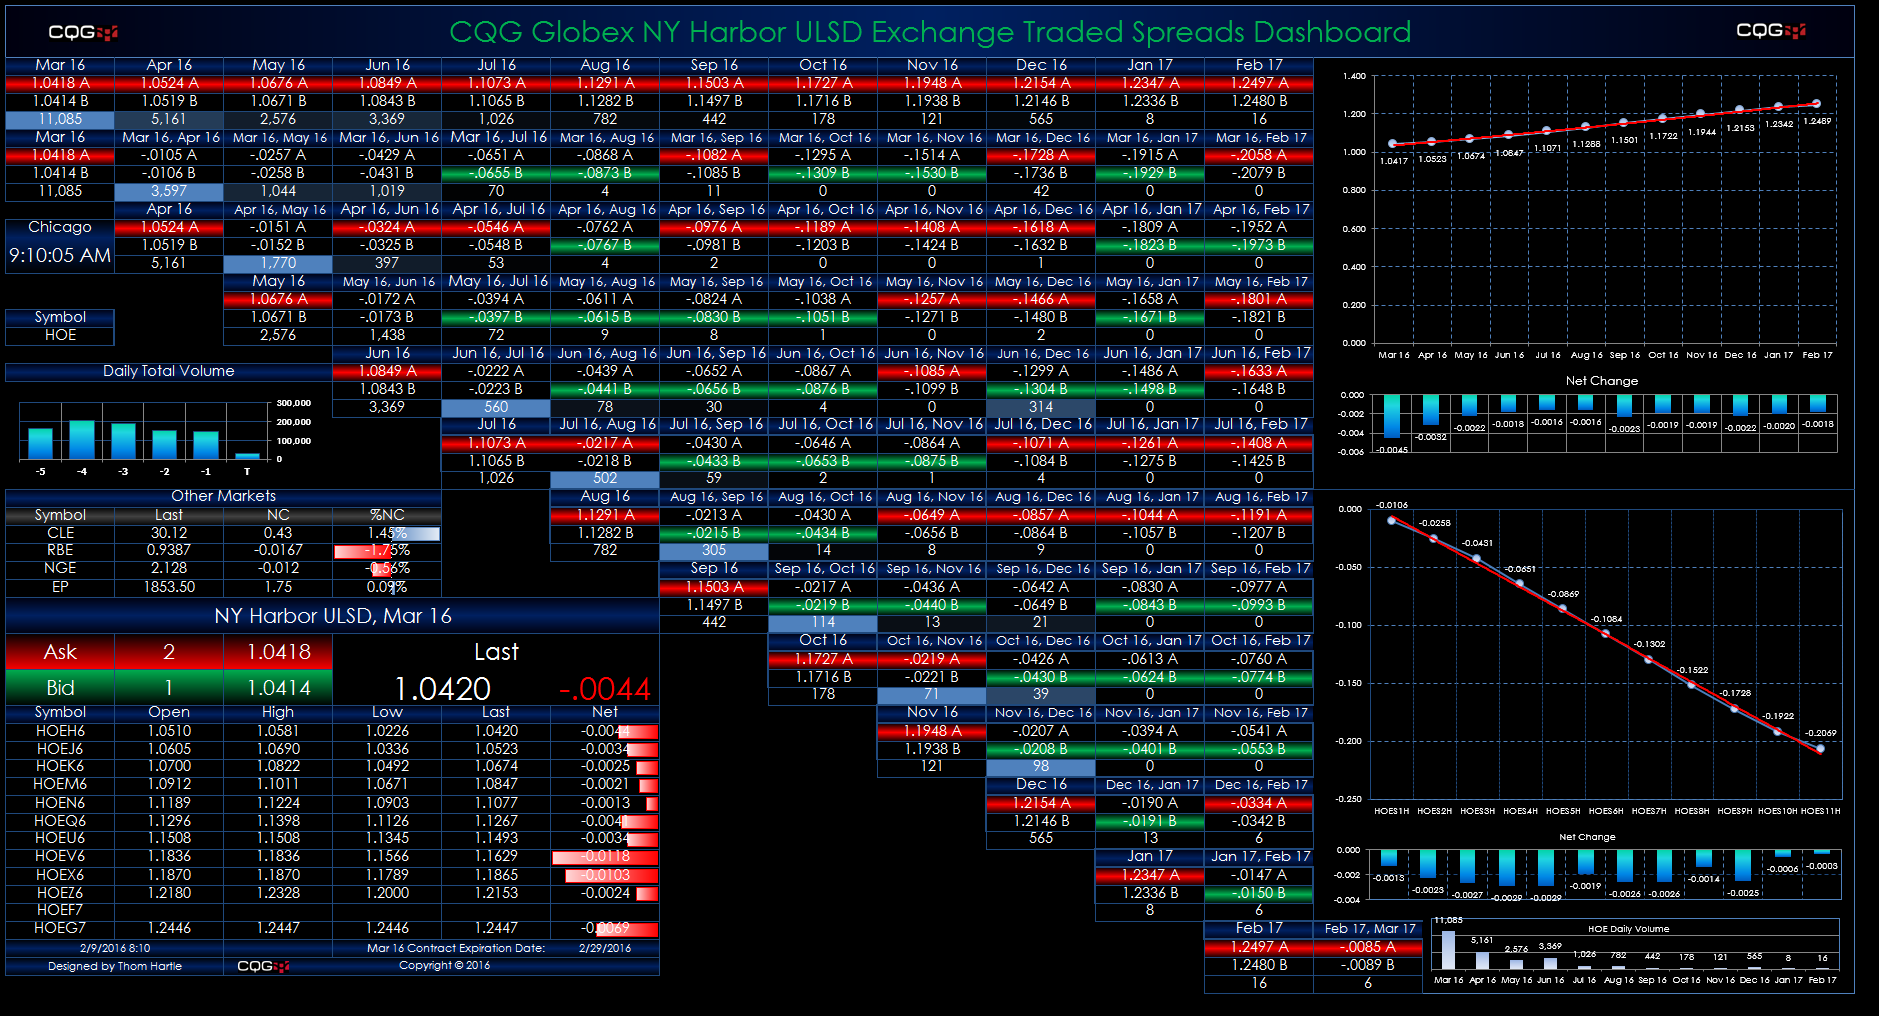
This Microsoft Excel® dashboard displays market data for heating oil spreads traded on the CME Globex platform. This monitor uses a matrix style format. The outrights are along the top row and the… more
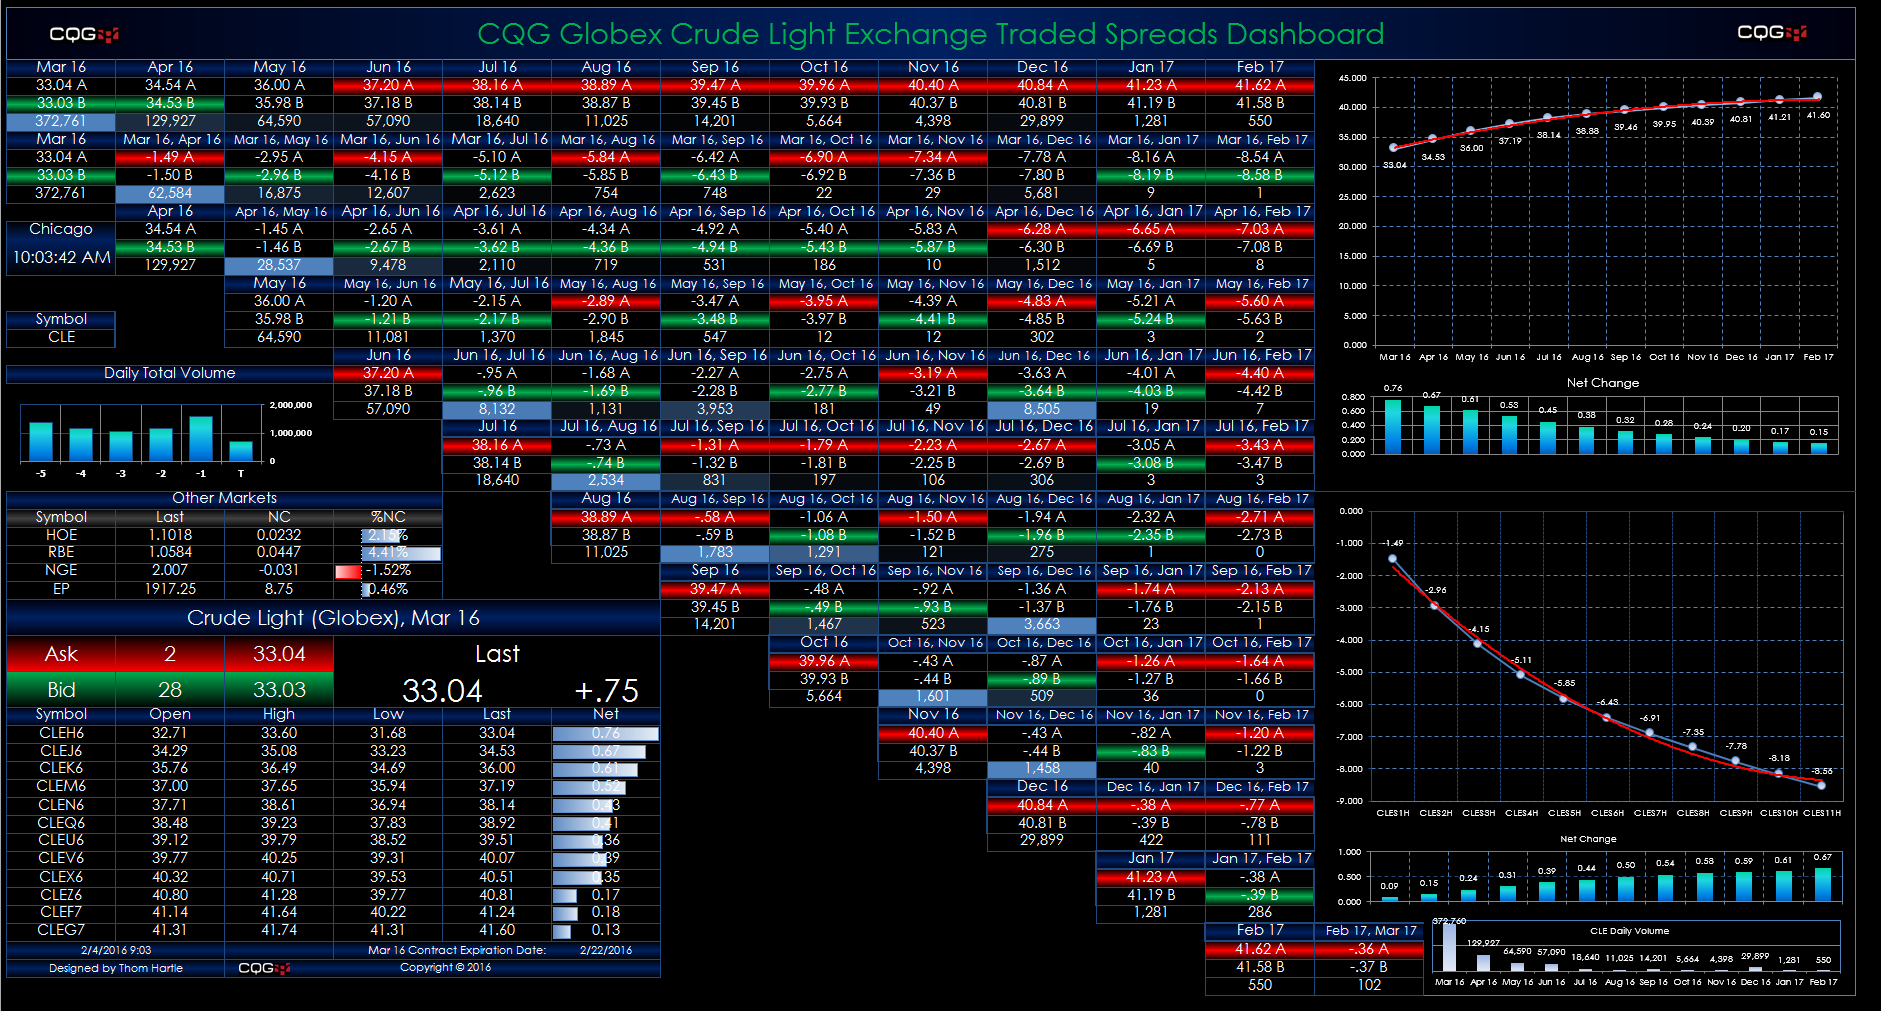
This Microsoft Excel® dashboard displays market data for crude oil spreads traded on the CME Globex platform. The dashboard is in a matrix-style format. The outrights are along the top row and the… more