This post details the downloadable Excel Market Performance Dashboard's features and functions. The dashboard has seven tabs (the first is data and the other tabs display a chart and a table of the current session's market activity):
Symbols & Data — Blocks of symbols for the other tabs and the current year and previous year's Annualized Percentage Net Change are calculated.
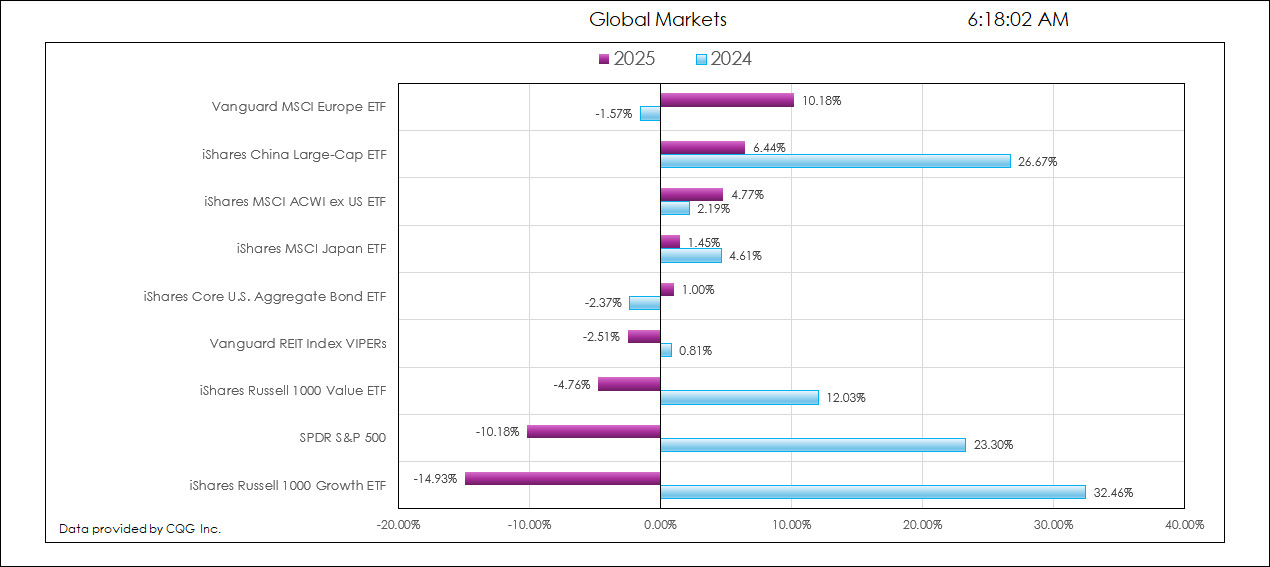
Global Markets — The chart displays the ranked current and previous year's performance of various ETFs representing Equities, Fixed Income, and Real Estate (requires the NYSE American enablement).
Commodities — The chart displays the ranked current and previous year's performance of 21 commodities (requires COMEX on Globex, CME on Globex, CBOT on Globex, London Metals Exchange, ICE Futures US Softs, and LME Select enablements).
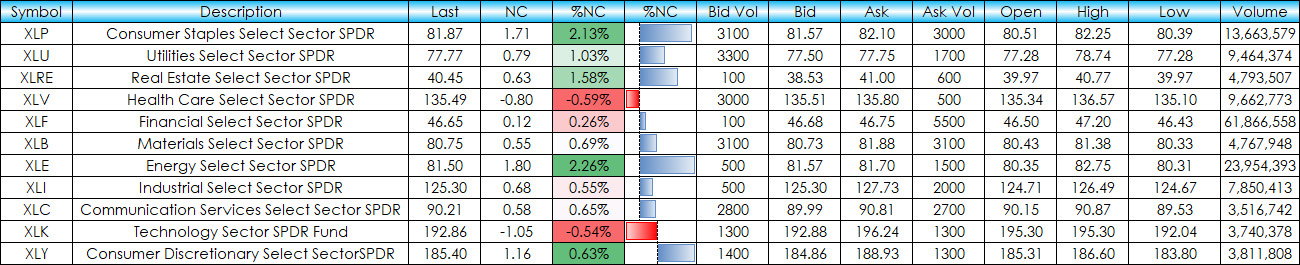
S&P Sectors — The chart displays the ranked current and previous year's performance of the eleven S&P Sectors (requires the NYSE American enablement).
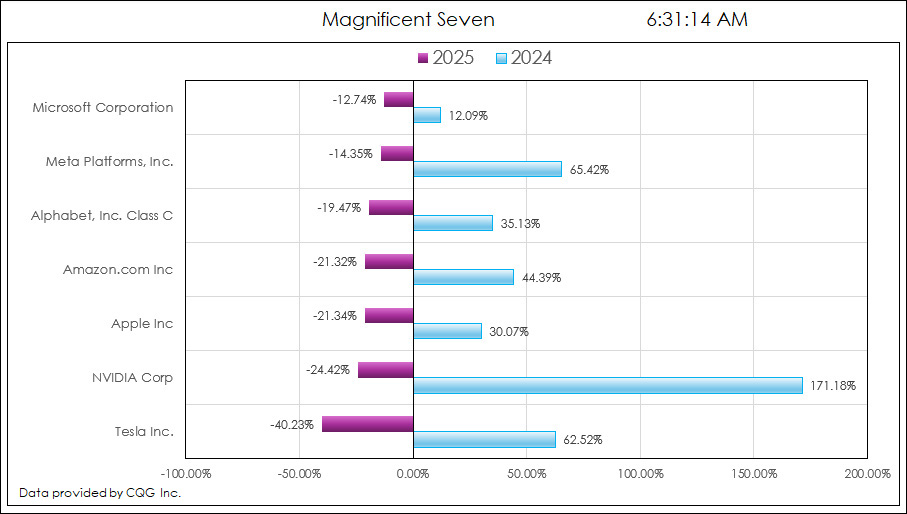
Magnificent Seven — The chart displays the ranked current and previous year's performance of Apple Inc., Amazon.com Inc., Alphabet, Inc. Class C, Meta Platforms, Inc., Microsoft Corporation, NVIDIA Corporation, and Tesla Inc (requires the NASDAQ enablement).
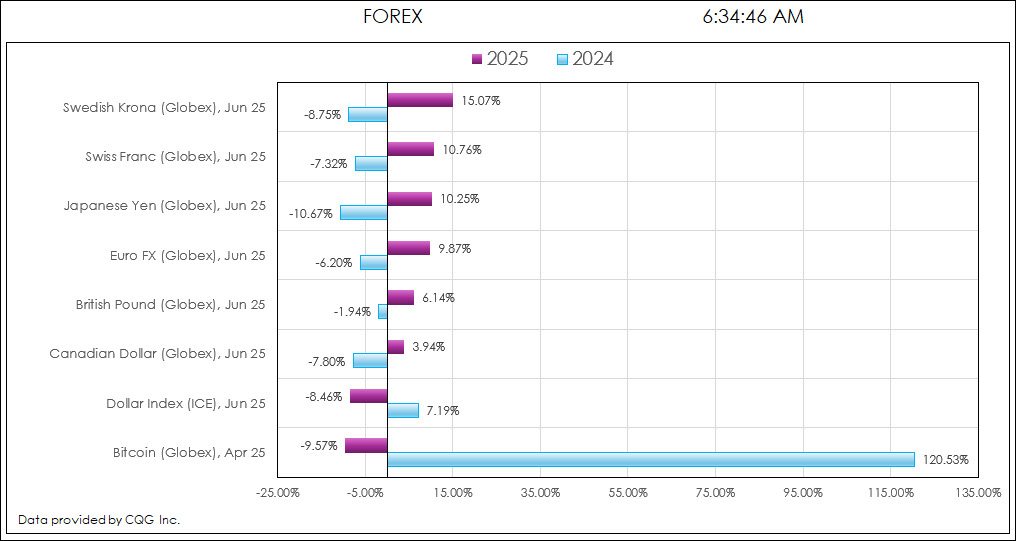
FOREX — The chart displays the ranked current and previous year's performance of the Dollar Index, the six currencies used to settle the Dollar Index and Bitcoin (requires ICE Futures US Financials and CME on Globex enablements).
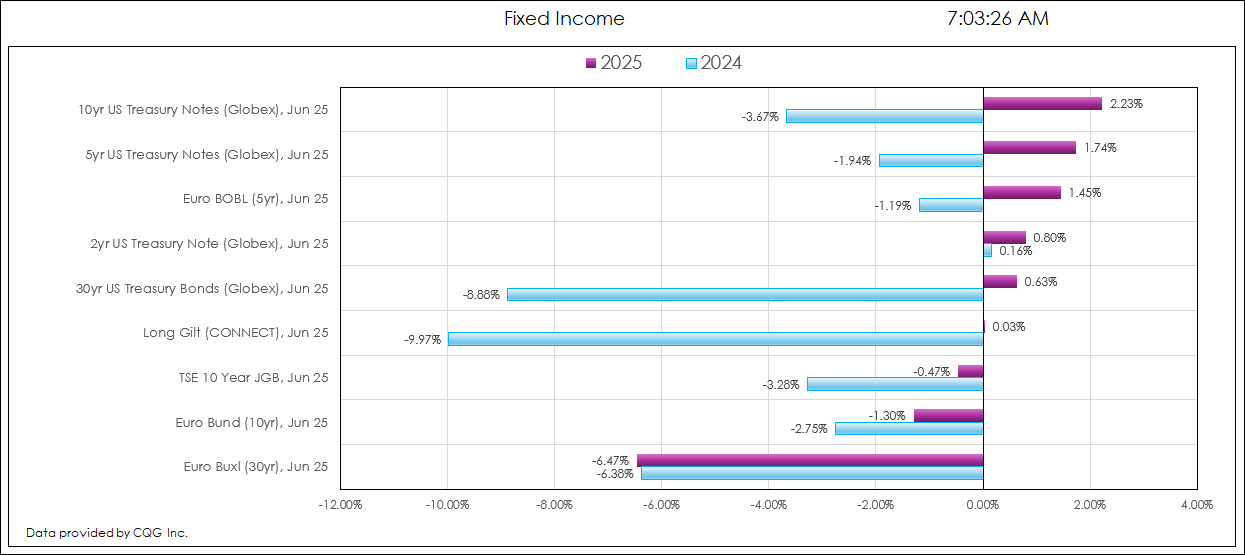
Fixed Income — The chart displays the ranked current year's and previous year's performance of fixed income futures markets (requires the Eurex, Osaka Exchange, CBOT on Globex, and ICE Futures Europe Financials enablements).
The image below is from the Symbols & Data tab. Column A are the symbols, column B are the long descriptions and column C are the RTD formulas for the current annual percentage net change for each symbol:
= RTD("cqg.rtd",,"StudyData",A2, "PCB","BaseType=Index,Index=1", "Close", "A","0","all",,,,"T")/100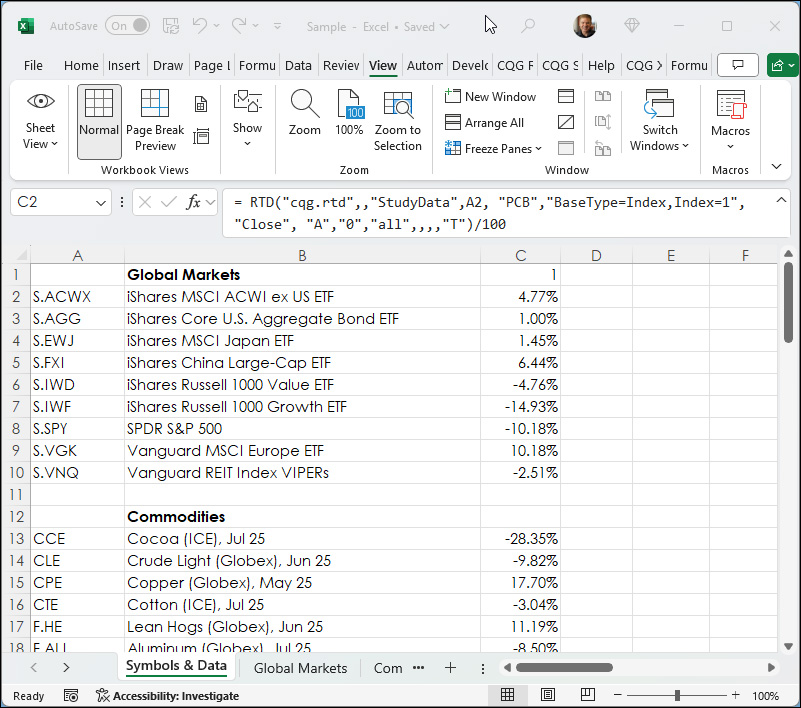
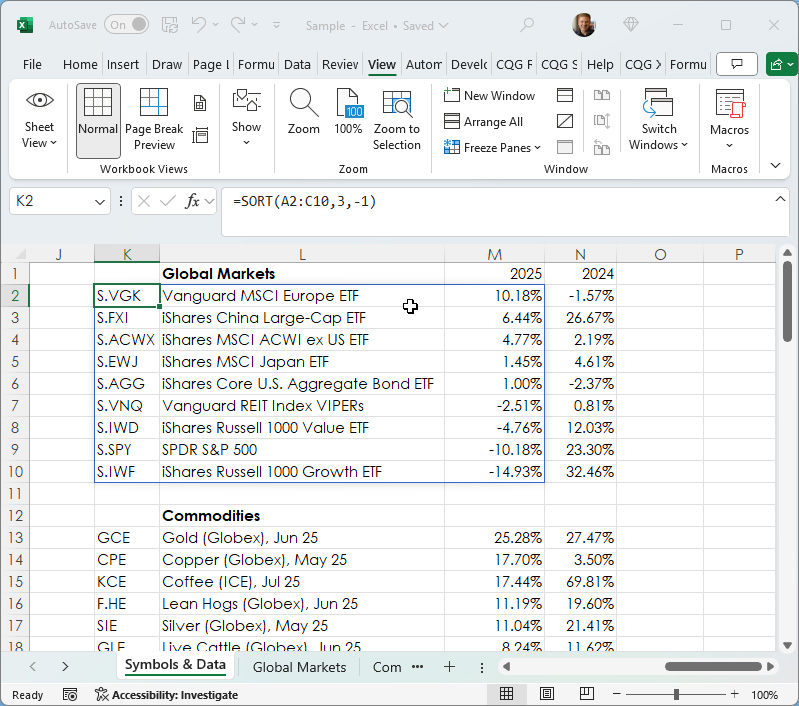
The image below is also from the Symbols & Data tab. Cell K2 is used to sort the block Cell A2:C10 using the third column (cells C2:C10) and the "-1" sets the Sort to return the highest first to the lowest:
=SORT(A2:C10,3,-1)
Then cells N2:N10 uses the ranked cells in cells K2:K10 to return the previous year's annual percentage net change:
= RTD("cqg.rtd",,"StudyData",K2, "PCB","BaseType=Index,Index=2", "Close", "A","-1","all",,,,"T")/100This process is used for each block of markets.
The Global Markets tab has a chart and a table. The chart displays two horizontal columns for each market (ranked from highest to lowest): The dark blue column is this year's annual percentage net change. The light blue column is the previous year's annual percentage net change.
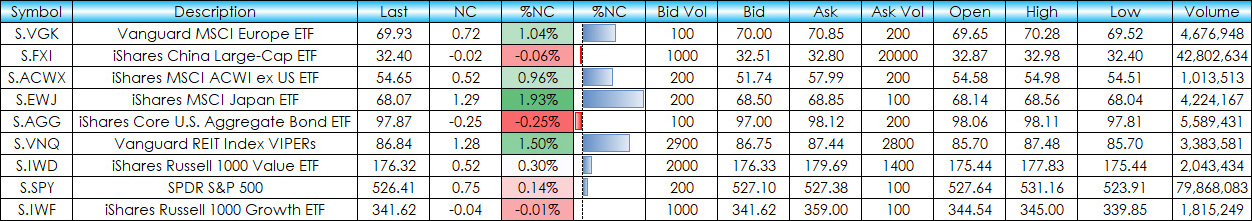
The table displays the current session's market activity. The symbols are used from the chart using this year's ranking.
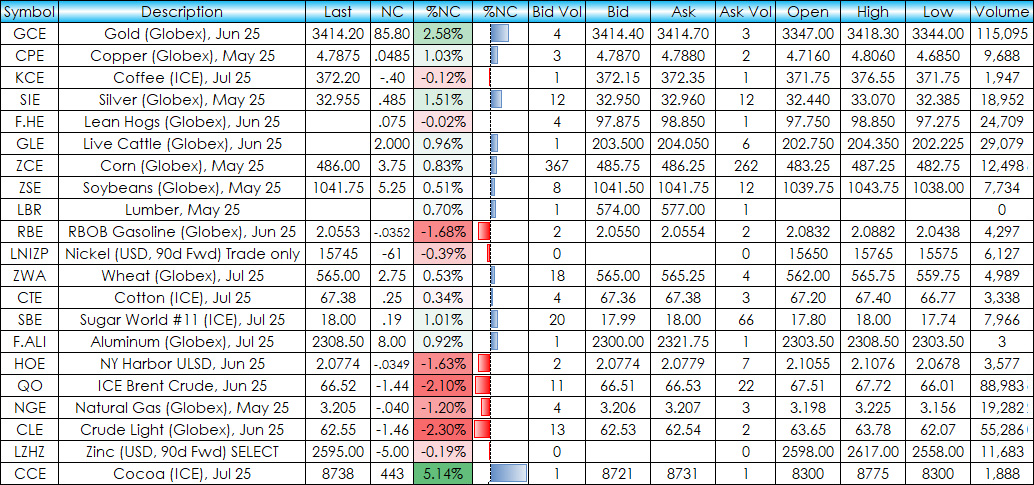
The Commodities tab has a chart and a table. The markets are ranked by this year's annual percentage net change (dark blue column).
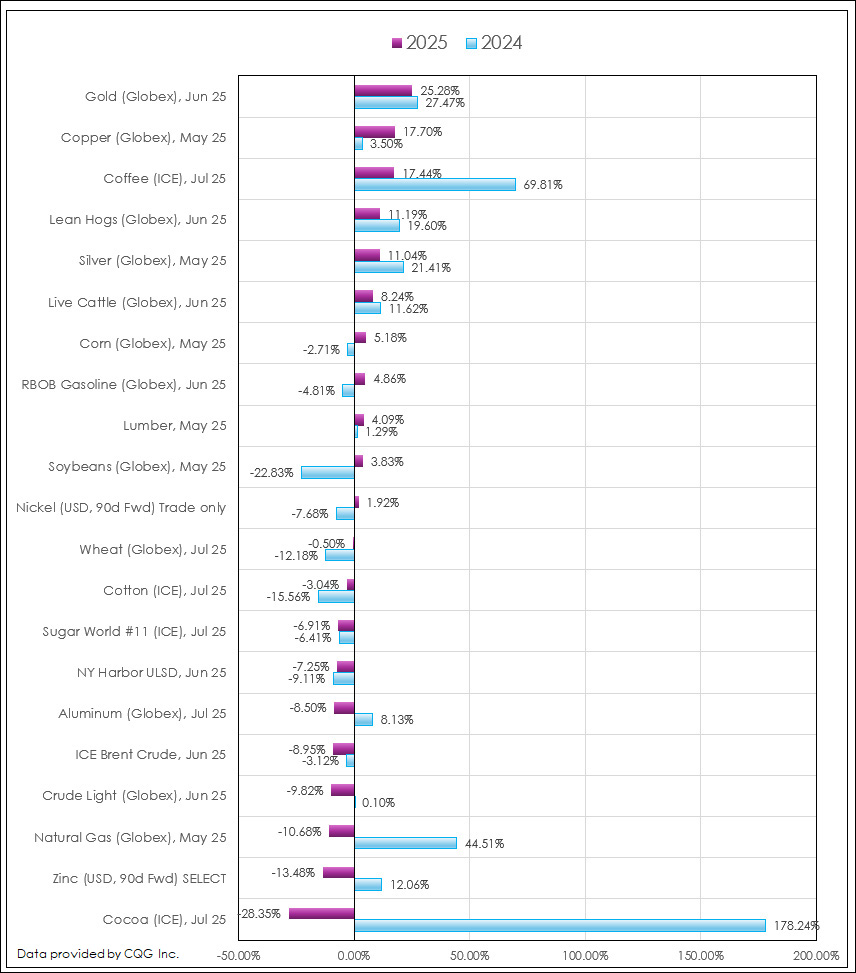
The table uses the sorted symbols from the chart. One challenge is that the order of the symbols can change and therefore a fixed price format for cells must change.
For example, Soybeans have two decimals and Heating Oil have four decimals. The following Excel formula is applied to all cells displaying a price or a price net change. The Excel formula is using the TEXT formula.
Simple example:
=TEXT(Value you want to format, "Format code you want to apply")
The Formula is using the RTD Tick size to determine how many decimals to use. Notice 2 is subtracted from the Tick size because the Tick size includes "0.".
=IFERROR(TEXT(RTD("cqg.rtd",,"ContractData",M4,"LastTradeToday",,"T"),IFS(MOD(RTD("cqg.rtd",,"ContractData",M4,"TickSize",,"T"),1)=0,"#",LEN(RTD("cqg.rtd",,"ContractData",M4,"TickSize",,"T"))-2=1,"#.00",LEN(RTD("cqg.rtd",,"ContractData",M4,"TickSize",,"T"))-2=2,"#.00",LEN(RTD("cqg.rtd",,"ContractData",M4,"TickSize",,"T"))-2=3,"#.000",LEN(RTD("cqg.rtd",,"ContractData",M4,"TickSize",,"T"))-2=4,"#.0000")),"")The maximum number of decimals is four.
The S&P Sectors tab displays the same chart style and market activity table.
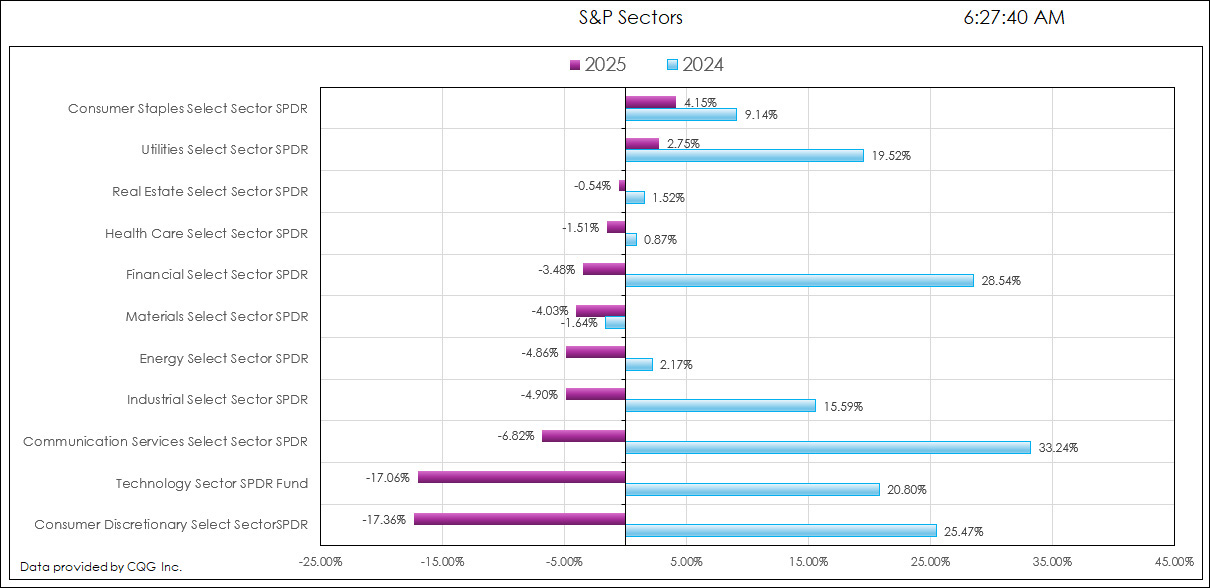
No special price formatting is required.
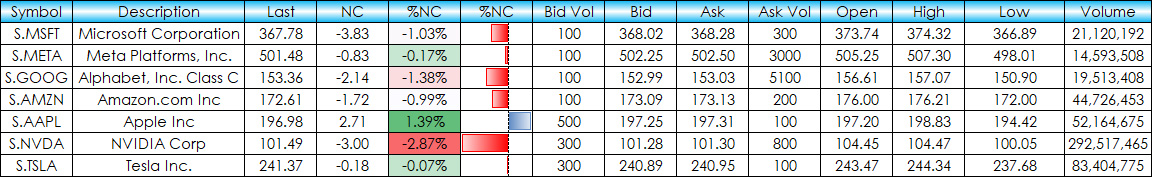
The Magnificent Seven tab shows (as of this writing) the reversal of fortunes for the seven tech stocks comparing the market performance in 2025 versus 2024.
No special price formatting is required.
The FOREX tab includes the Dollar Index futures contract, and the six FX futures contracts used for the settlement of the Dollar Index.
Like the Commodities tab the FX futures contract price decimal formatting ranges from no decimal (Bitcoin) to seven decimals (Japanese Yen).
This is the Excel formula applied to all prices and price changes to properly format the prices with the correct number of decimals.
=IFERROR(TEXT(RTD("cqg.rtd",,"ContractData",F28,"LastTradeToday",,"T"),IFS(MOD(RTD("cqg.rtd",,"ContractData",F28,"TickSize",,"T"),1)=0,"#",LEN(RTD("cqg.rtd",,"ContractData",F28,"TickSize",,"T"))-2=2,"#.00",LEN(RTD("cqg.rtd",,"ContractData",F28,"TickSize",,"T"))-2=3,"#.000",LEN(RTD("cqg.rtd",,"ContractData",F28,"TickSize",,"T"))-2=4,"#.0000",LEN(RTD("cqg.rtd",,"ContractData",F28,"TickSize",,"T"))-2=5,"#.00000",LEN(RTD("cqg.rtd",,"ContractData",F28,"TickSize",,"T"))-2=6,"#.000000",LEN(RTD("cqg.rtd",,"ContractData",F28,"TickSize",,"T"))-2=7,"#.0000000")),"")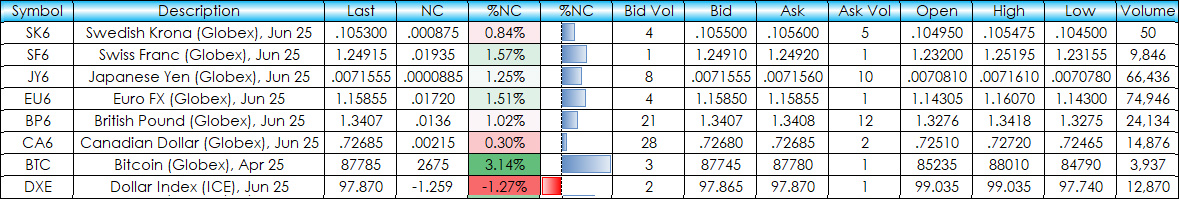
The final tab is the fixed income futures markets. The US Treasury fixed income markets are quoted in 32nds, and the other fixed income markets are quoted in decimals. The RTD formula for "Last Quote Today" has a price formatting parameter. "B" is for 32nds and "T" is for decimal.
The Excel formula to determine the price formatting is:
=IFERROR(RTD("cqg.rtd", ,"ContractData", E28, "LastQuoteToday",, IF(LEN(RTD("cqg.rtd", ,"ContractData", E28, "TickSize",, "T"))>4,"B","T")),"")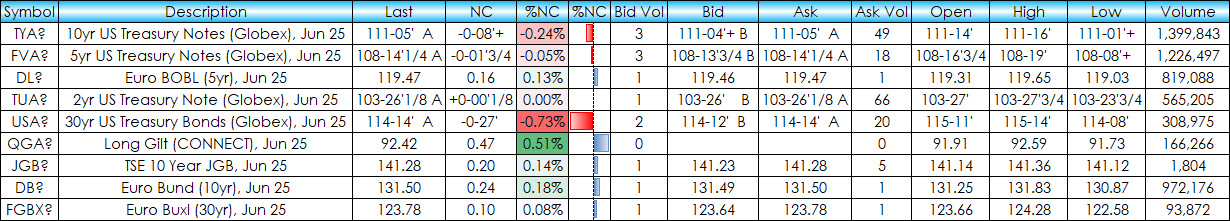
The downloadable sample is not locked. Symbols can be changed on the first tab.
Requirements: CQG Integrated Client or QTrader, and Excel 365 (locally installed, not in the Cloud) or more recent. Required enablements are discussed in the opening section of the post.